Copyright
©The Author(s) 2018.
World J Gastroenterol. Mar 14, 2018; 24(10): 1167-1180
Published online Mar 14, 2018. doi: 10.3748/wjg.v24.i10.1167
Published online Mar 14, 2018. doi: 10.3748/wjg.v24.i10.1167
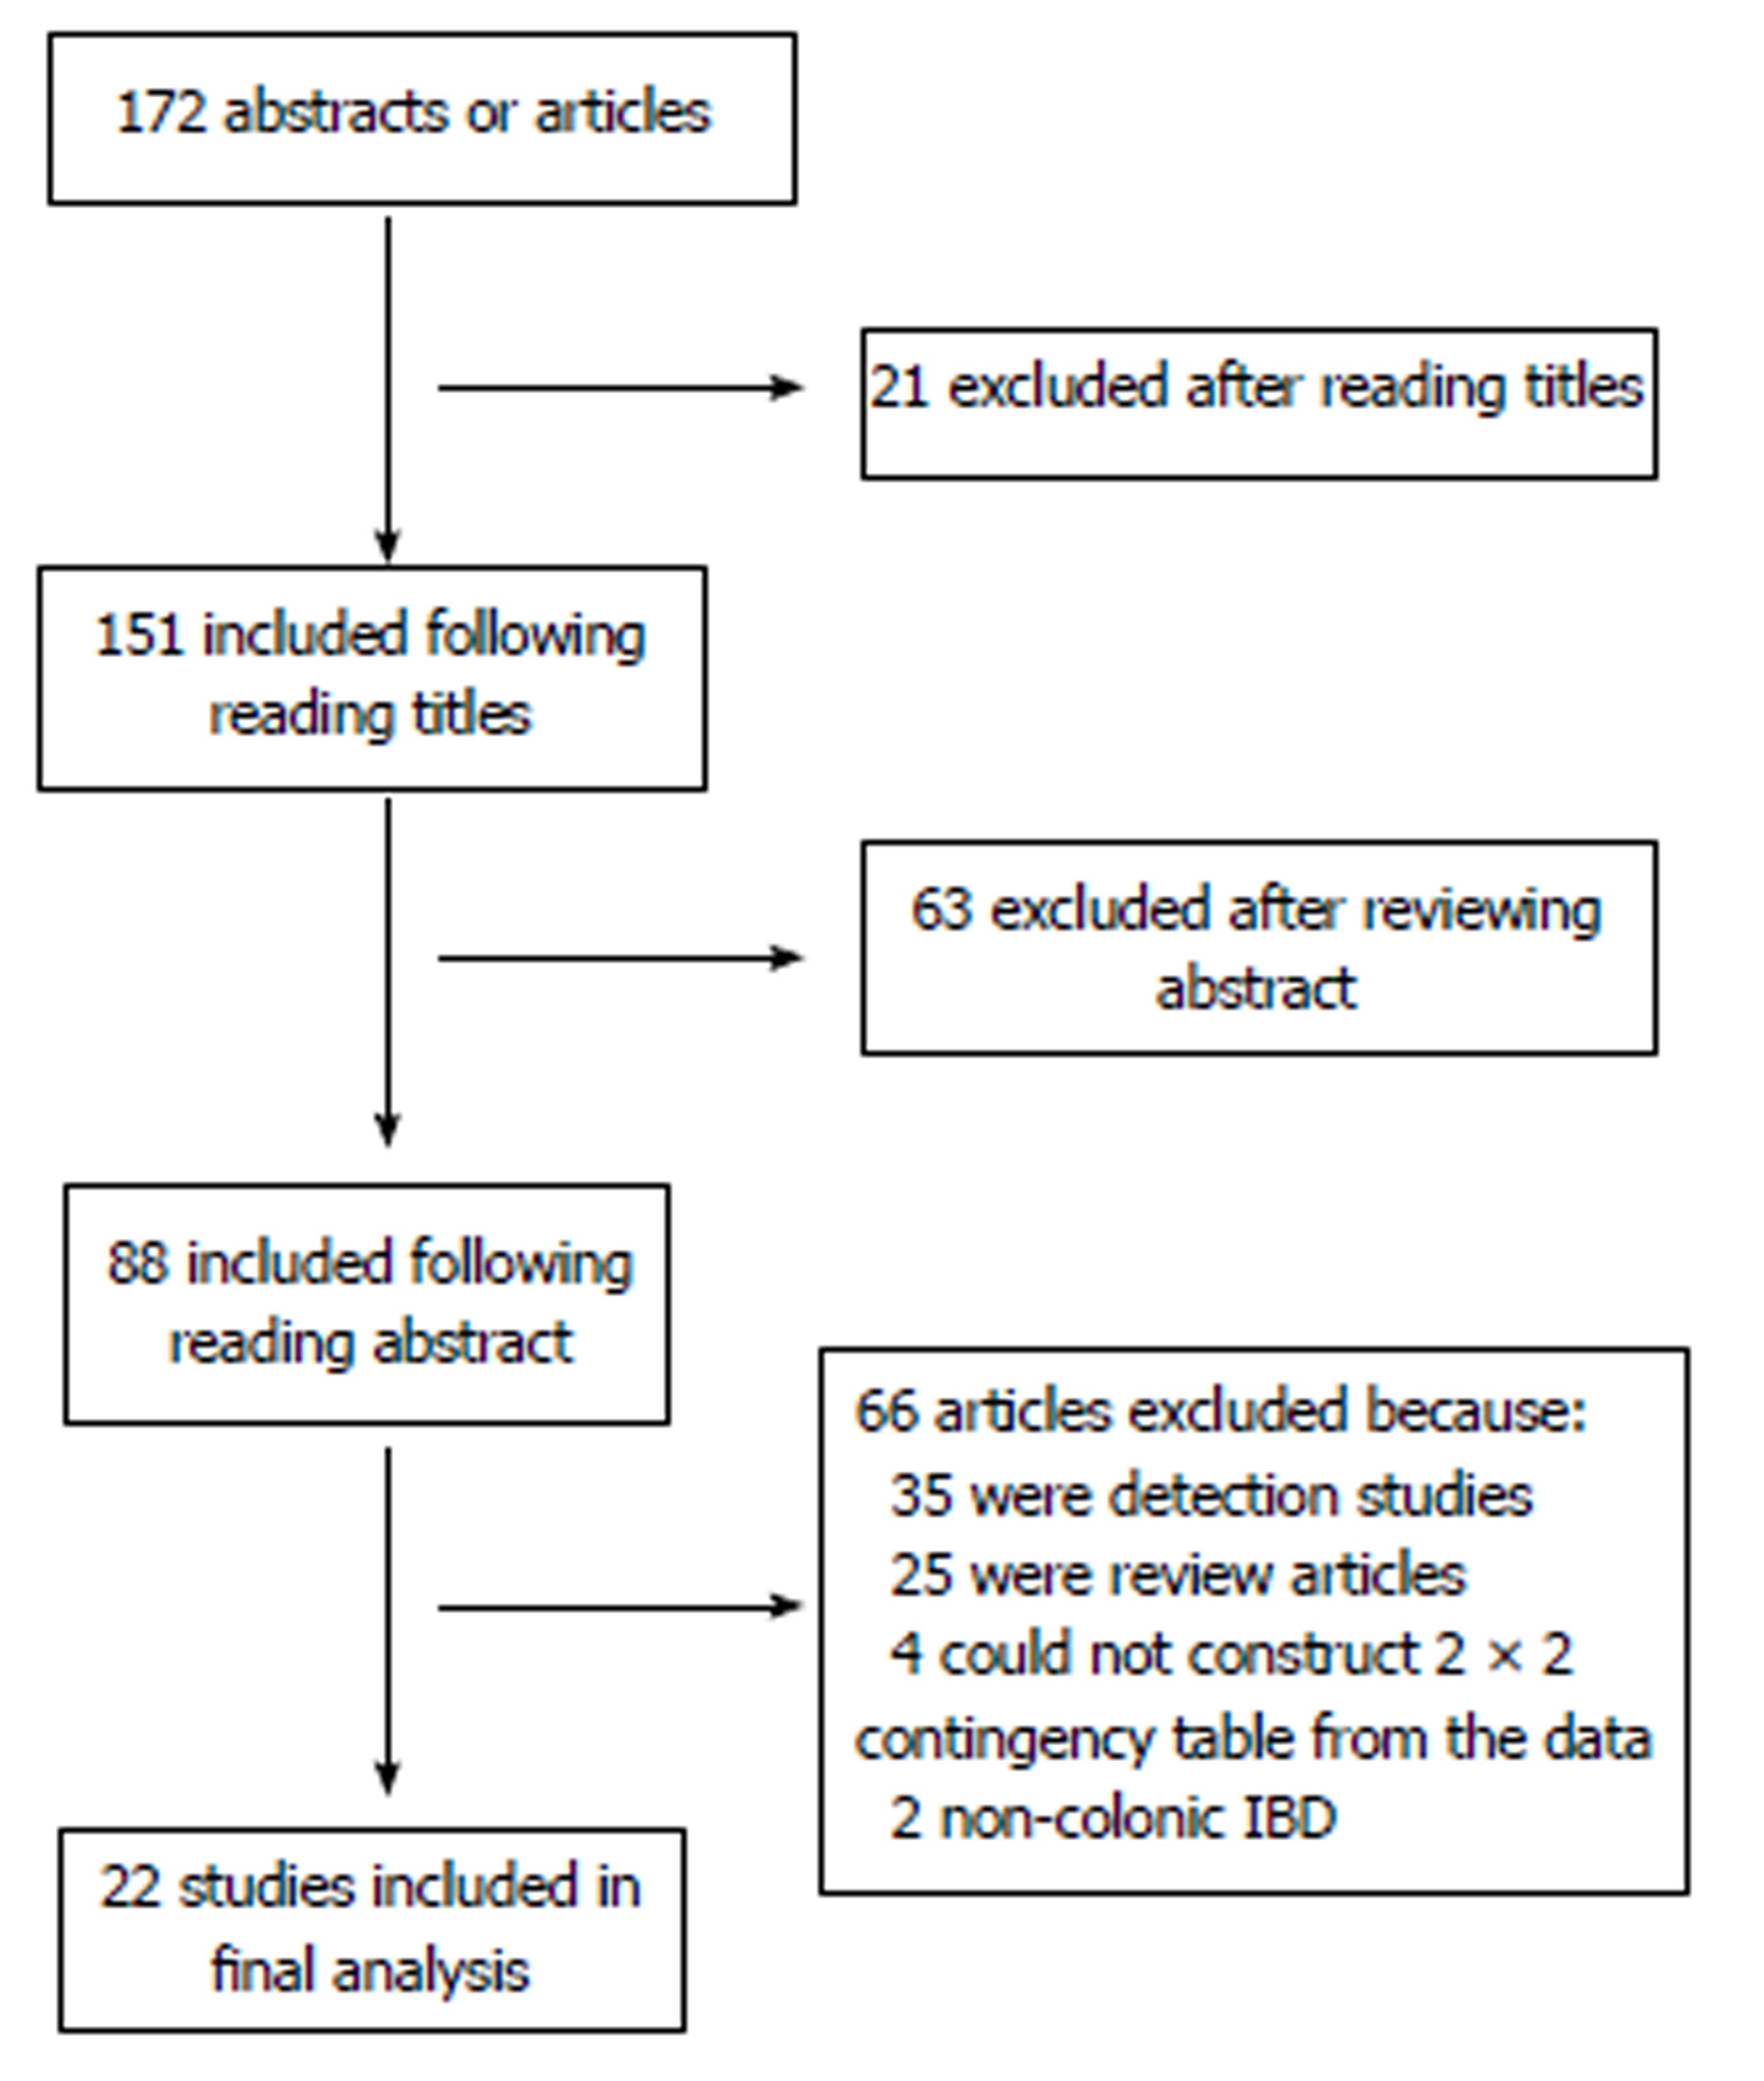
Figure 1 Study flow chart for studies eventually included into the meta-analysis.
IBD: Inflammatory bowel disease.
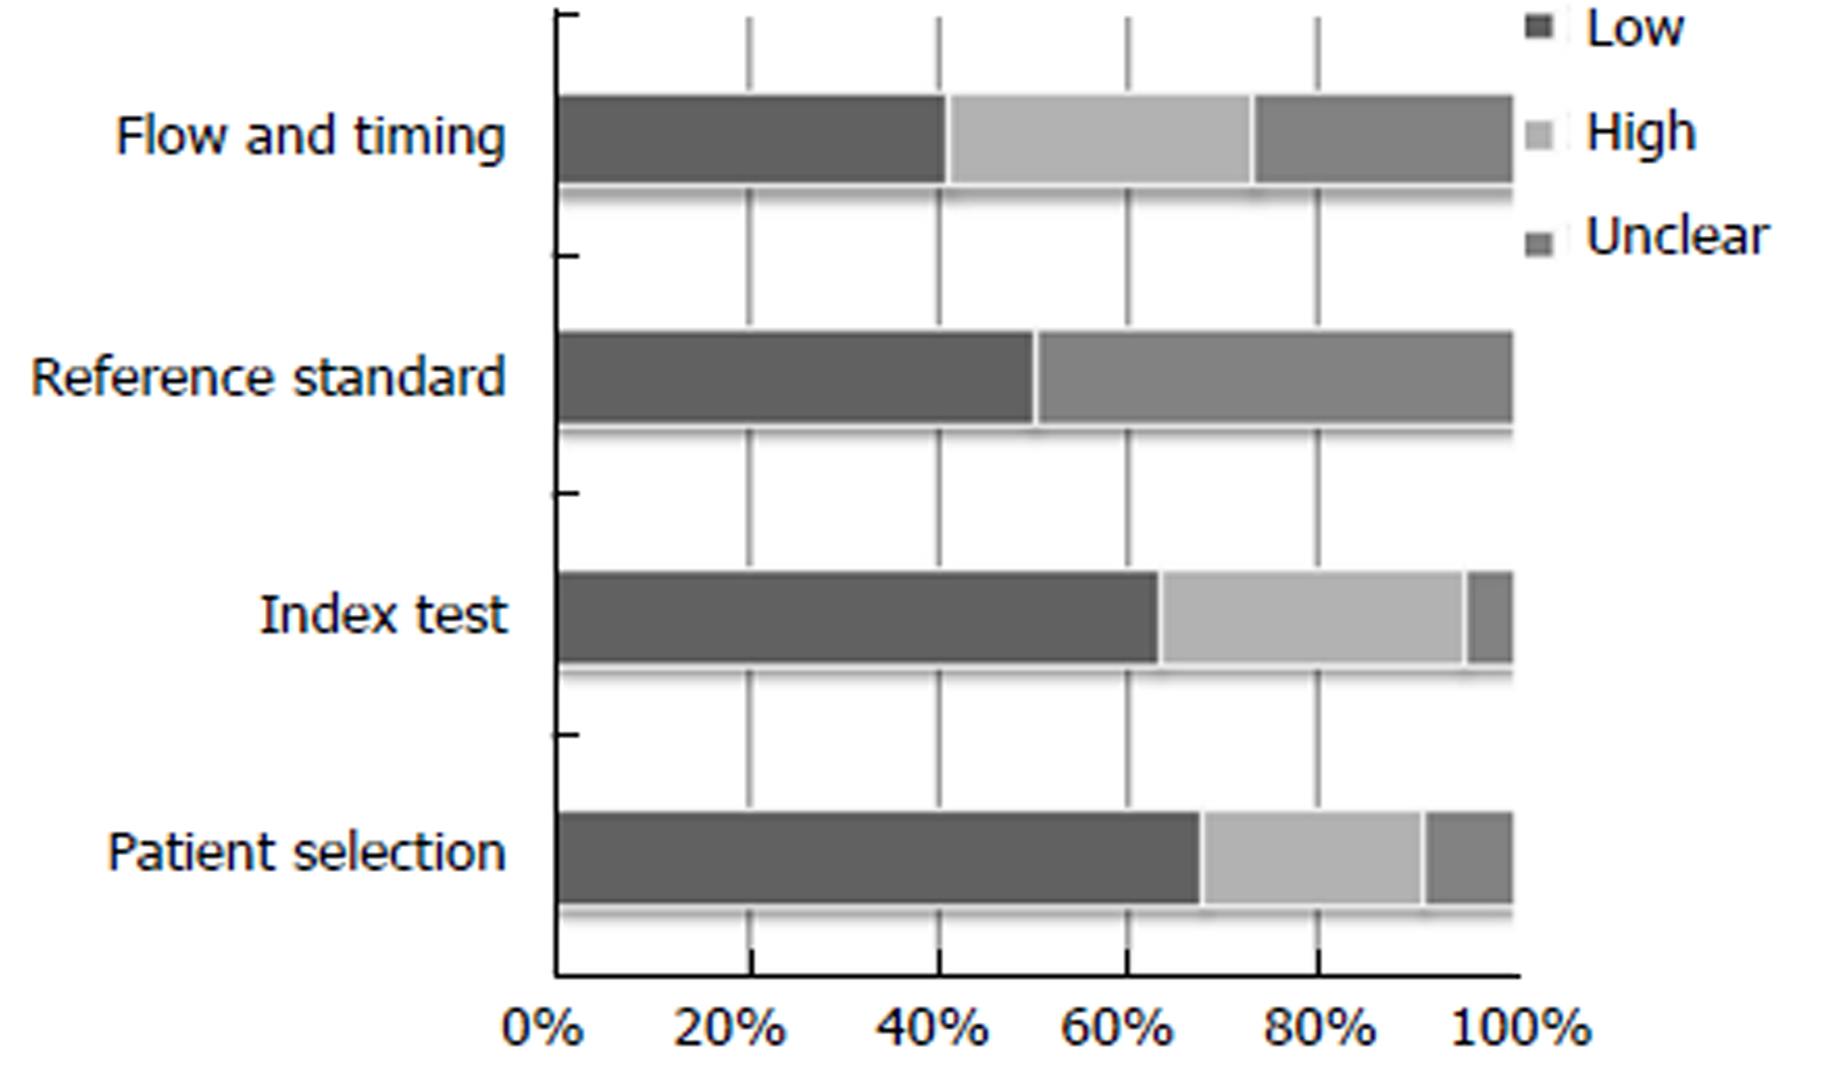
Figure 2 Stacked bar charts showing proportion of studies with low, high or unclear risks of bias.
Vertical axis represents the four domains of the quality assessment of diagnostic accuracy studies 2.
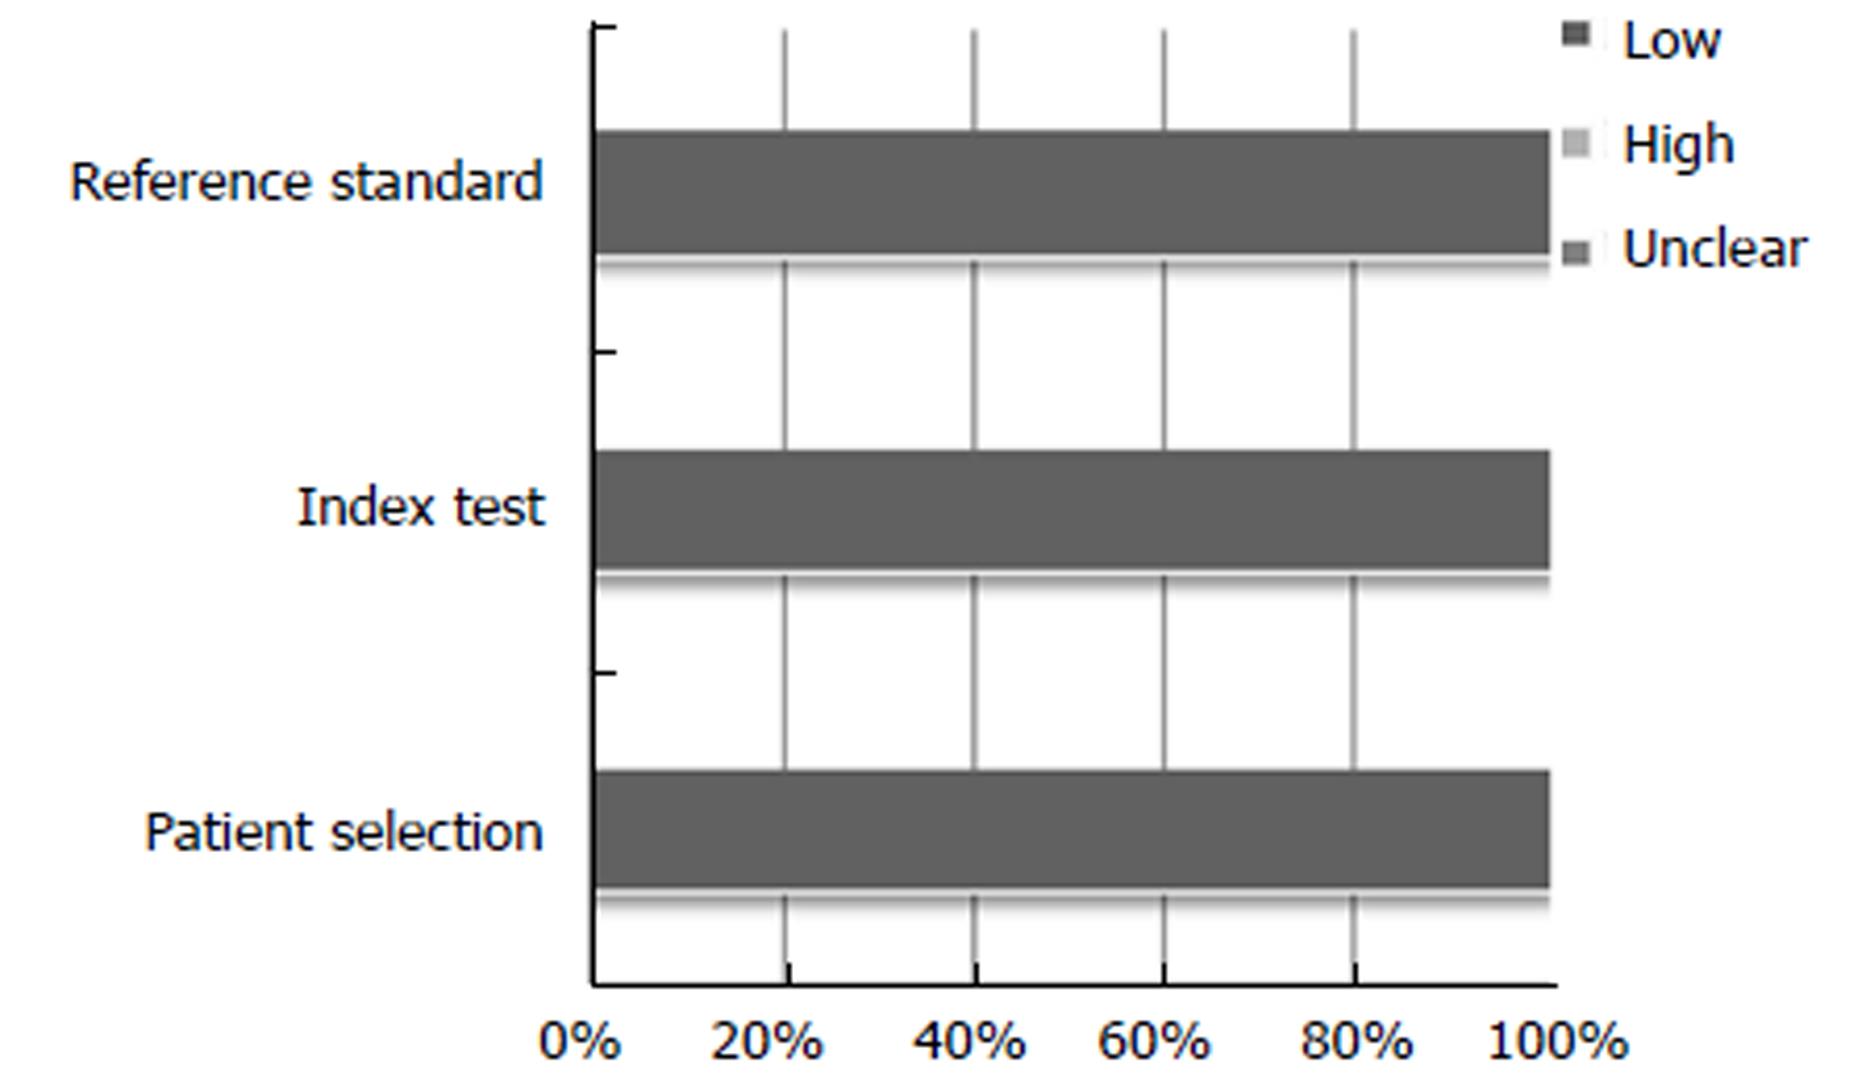
Figure 3 Stacked bar charts showing proportion of studies with low, high or unclear applicability.
Vertical axis represents the three domains of the quality assessment of diagnostic accuracy studies 2.
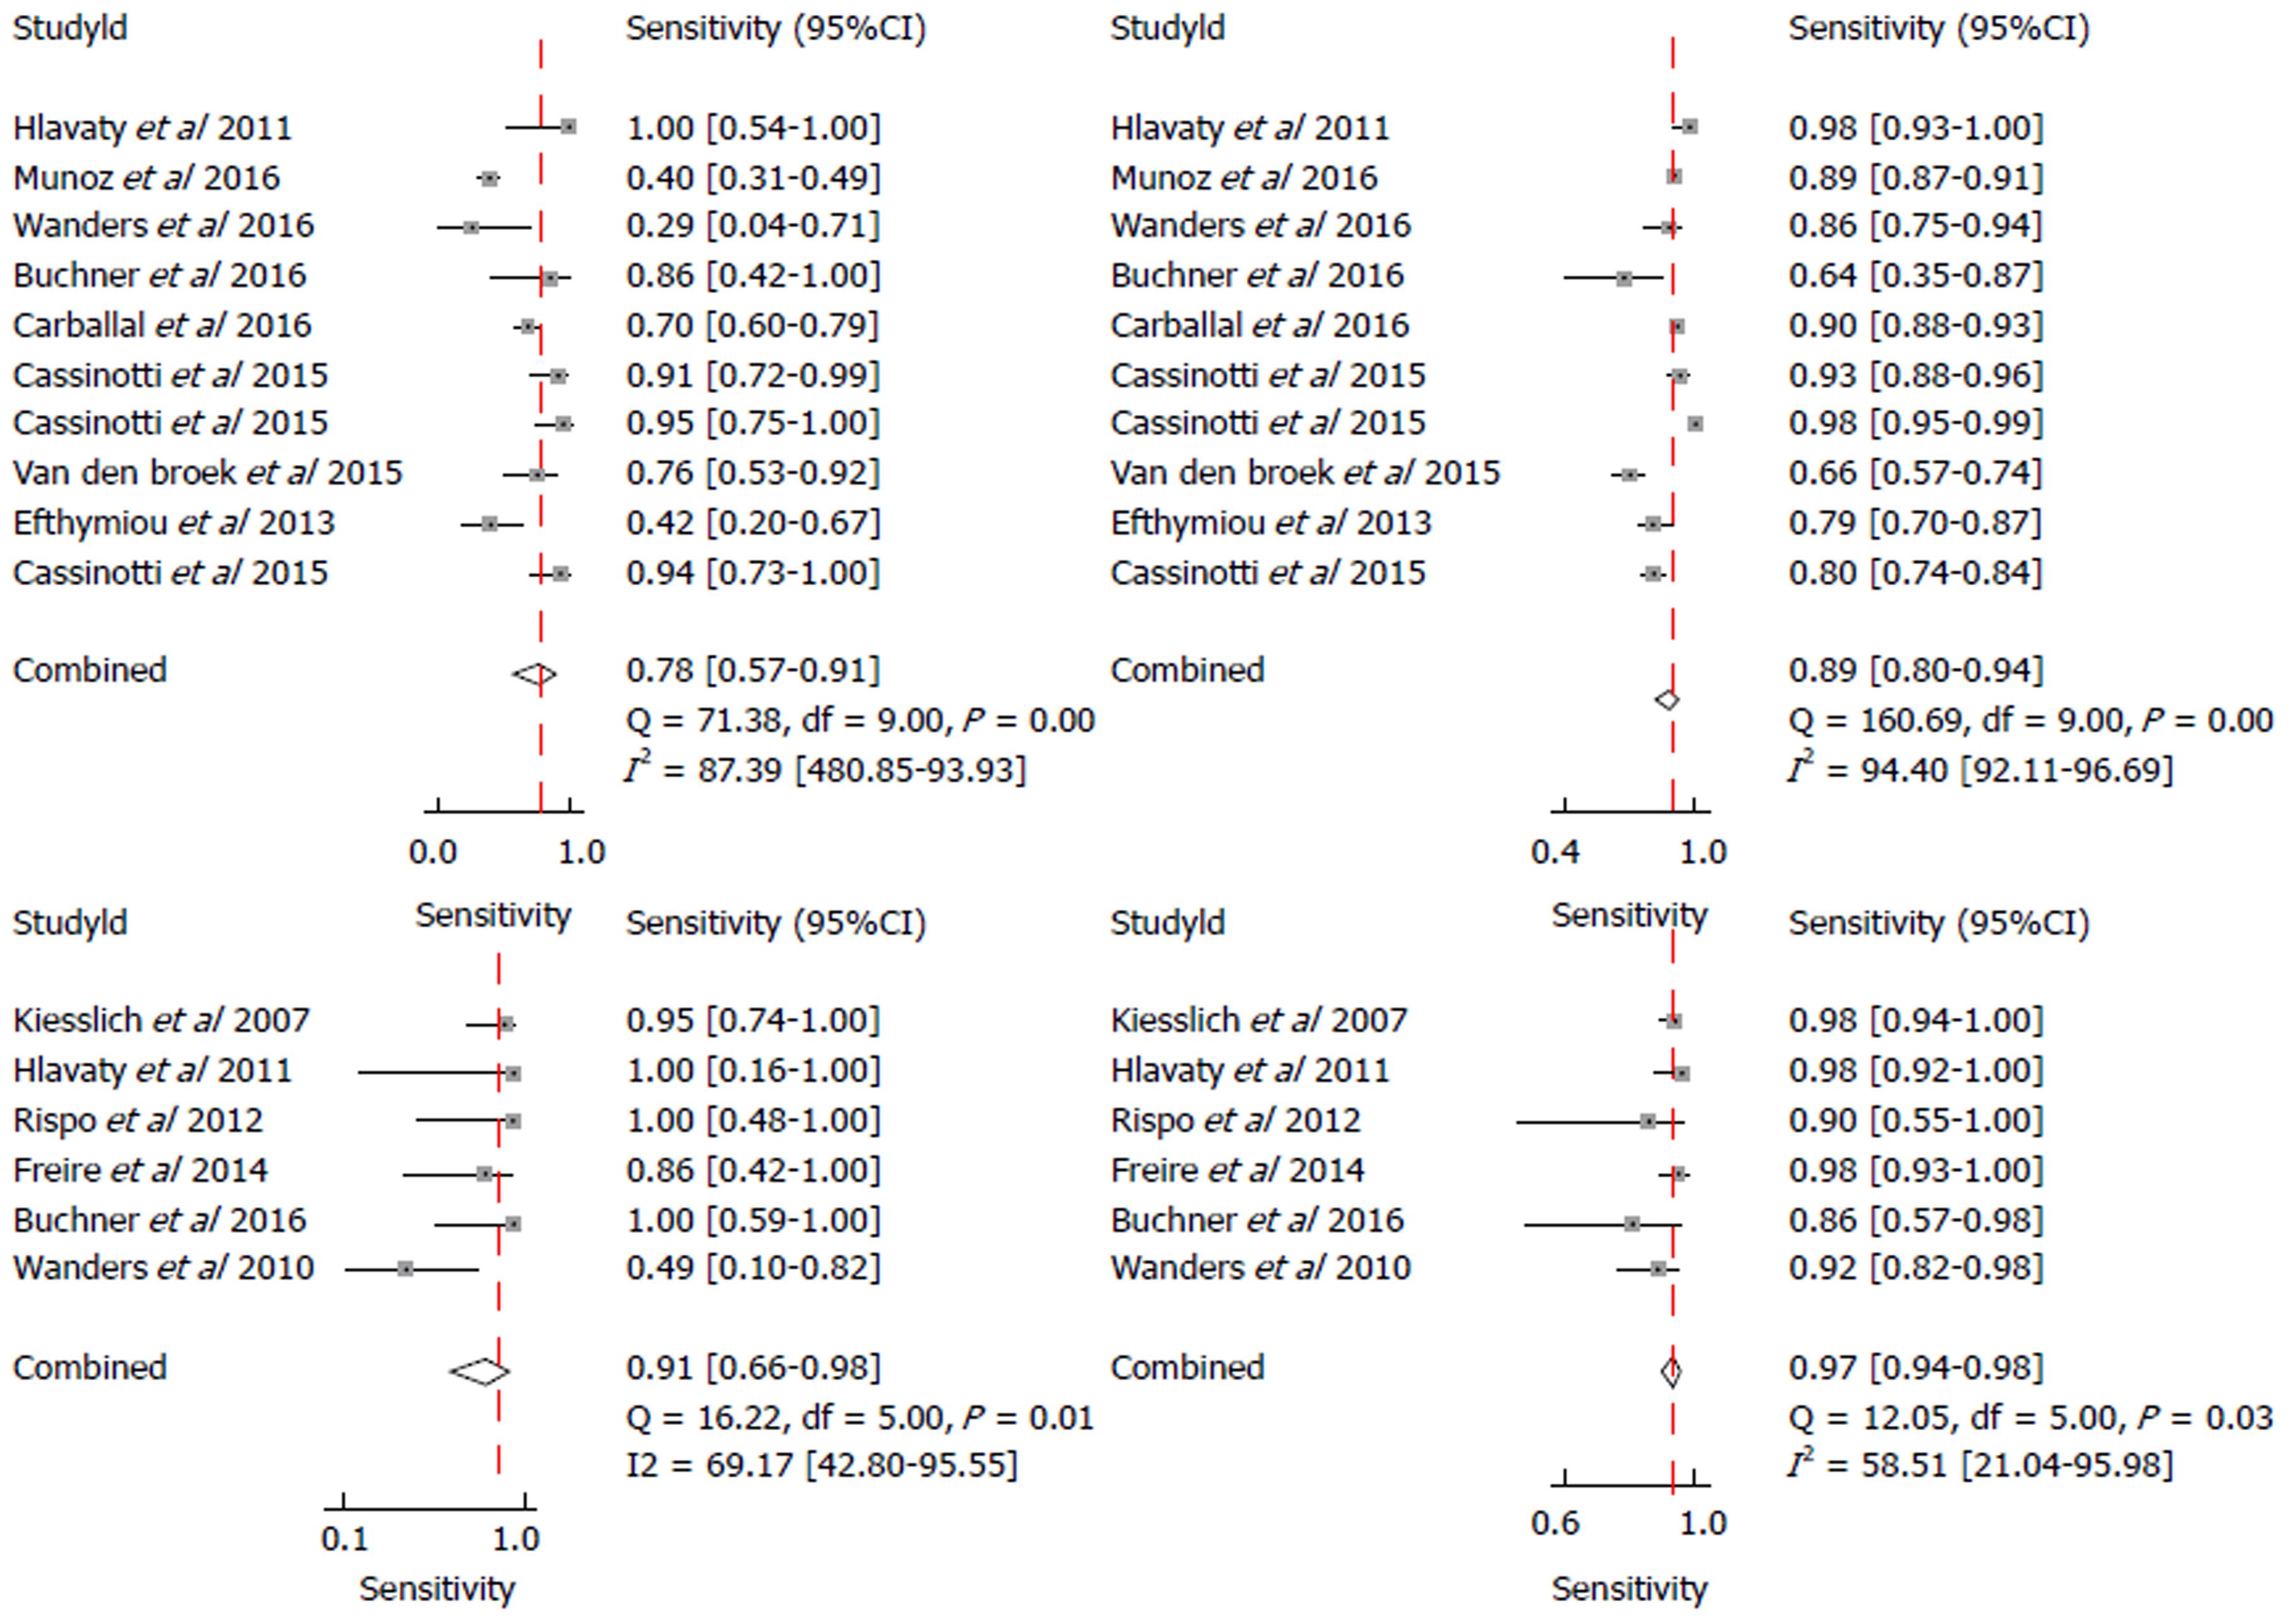
Figure 4 Forest plot for real-time Kudo pit pattern (A), and forest plot for real-time confocal laser endomicroscopy (B).
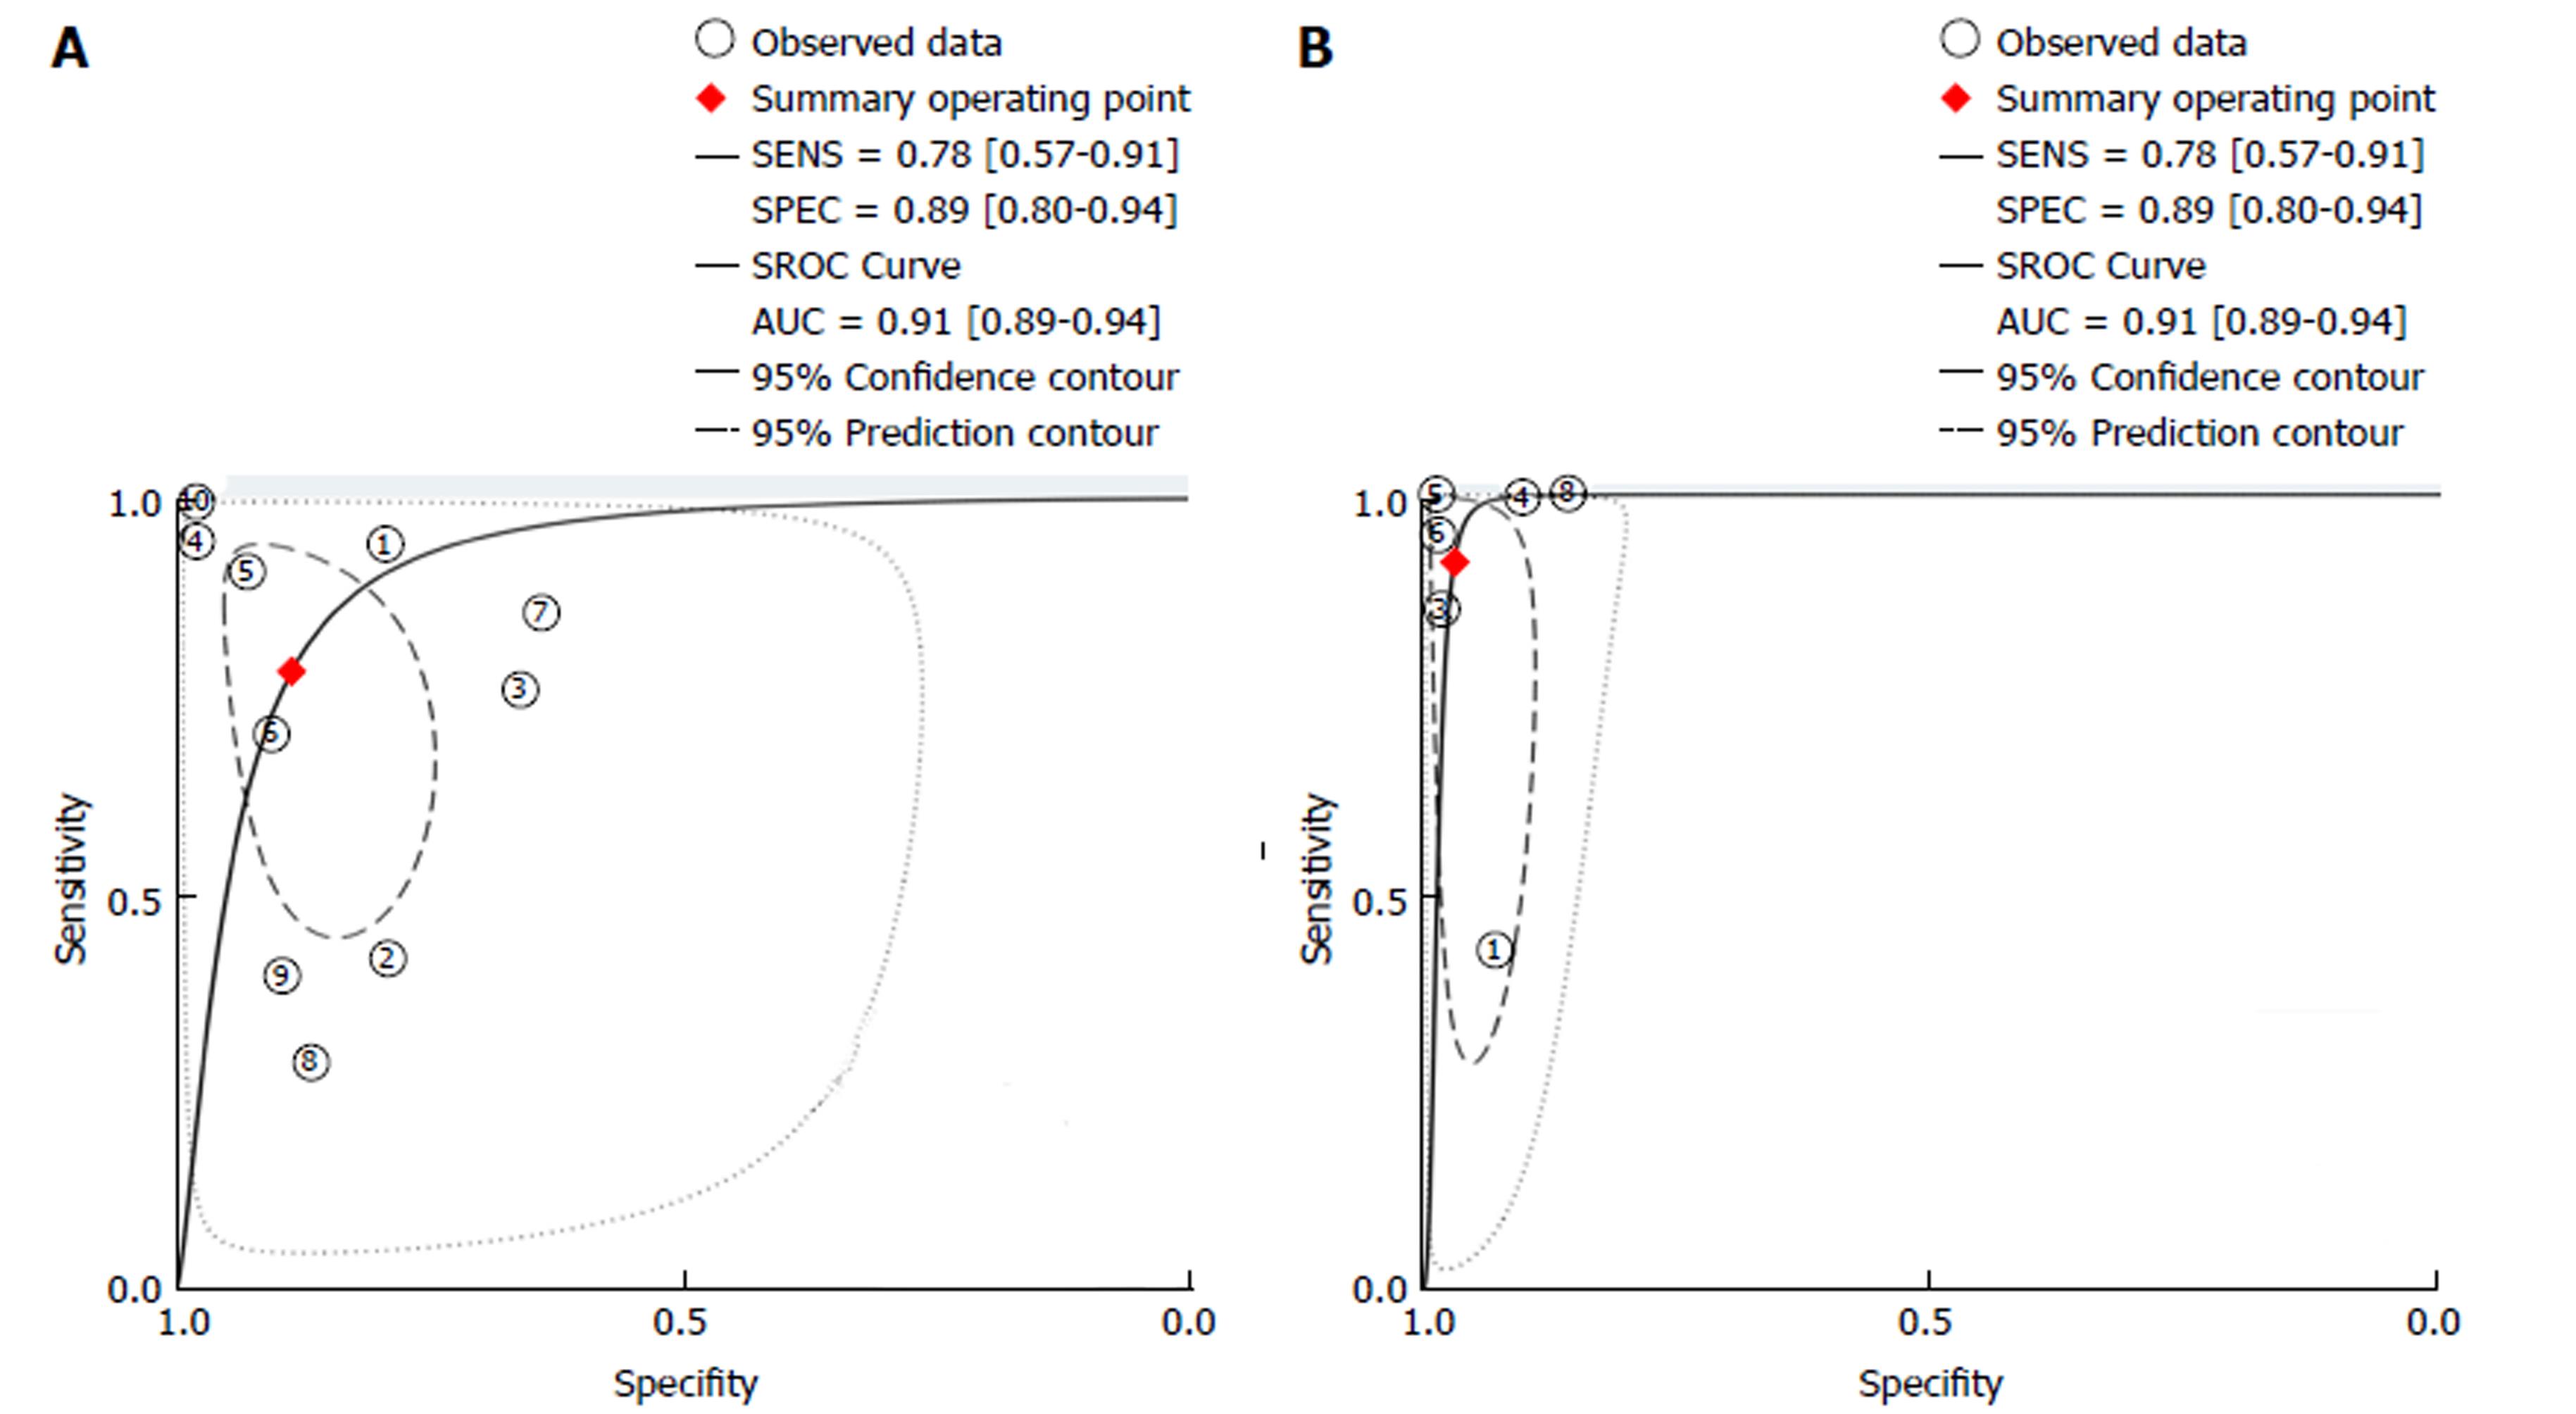
Figure 5 Area under SROC curve for real-time Kudo pit pattern (A) and area under SROC curve for real-time confocal laser endomicroscopy (B).
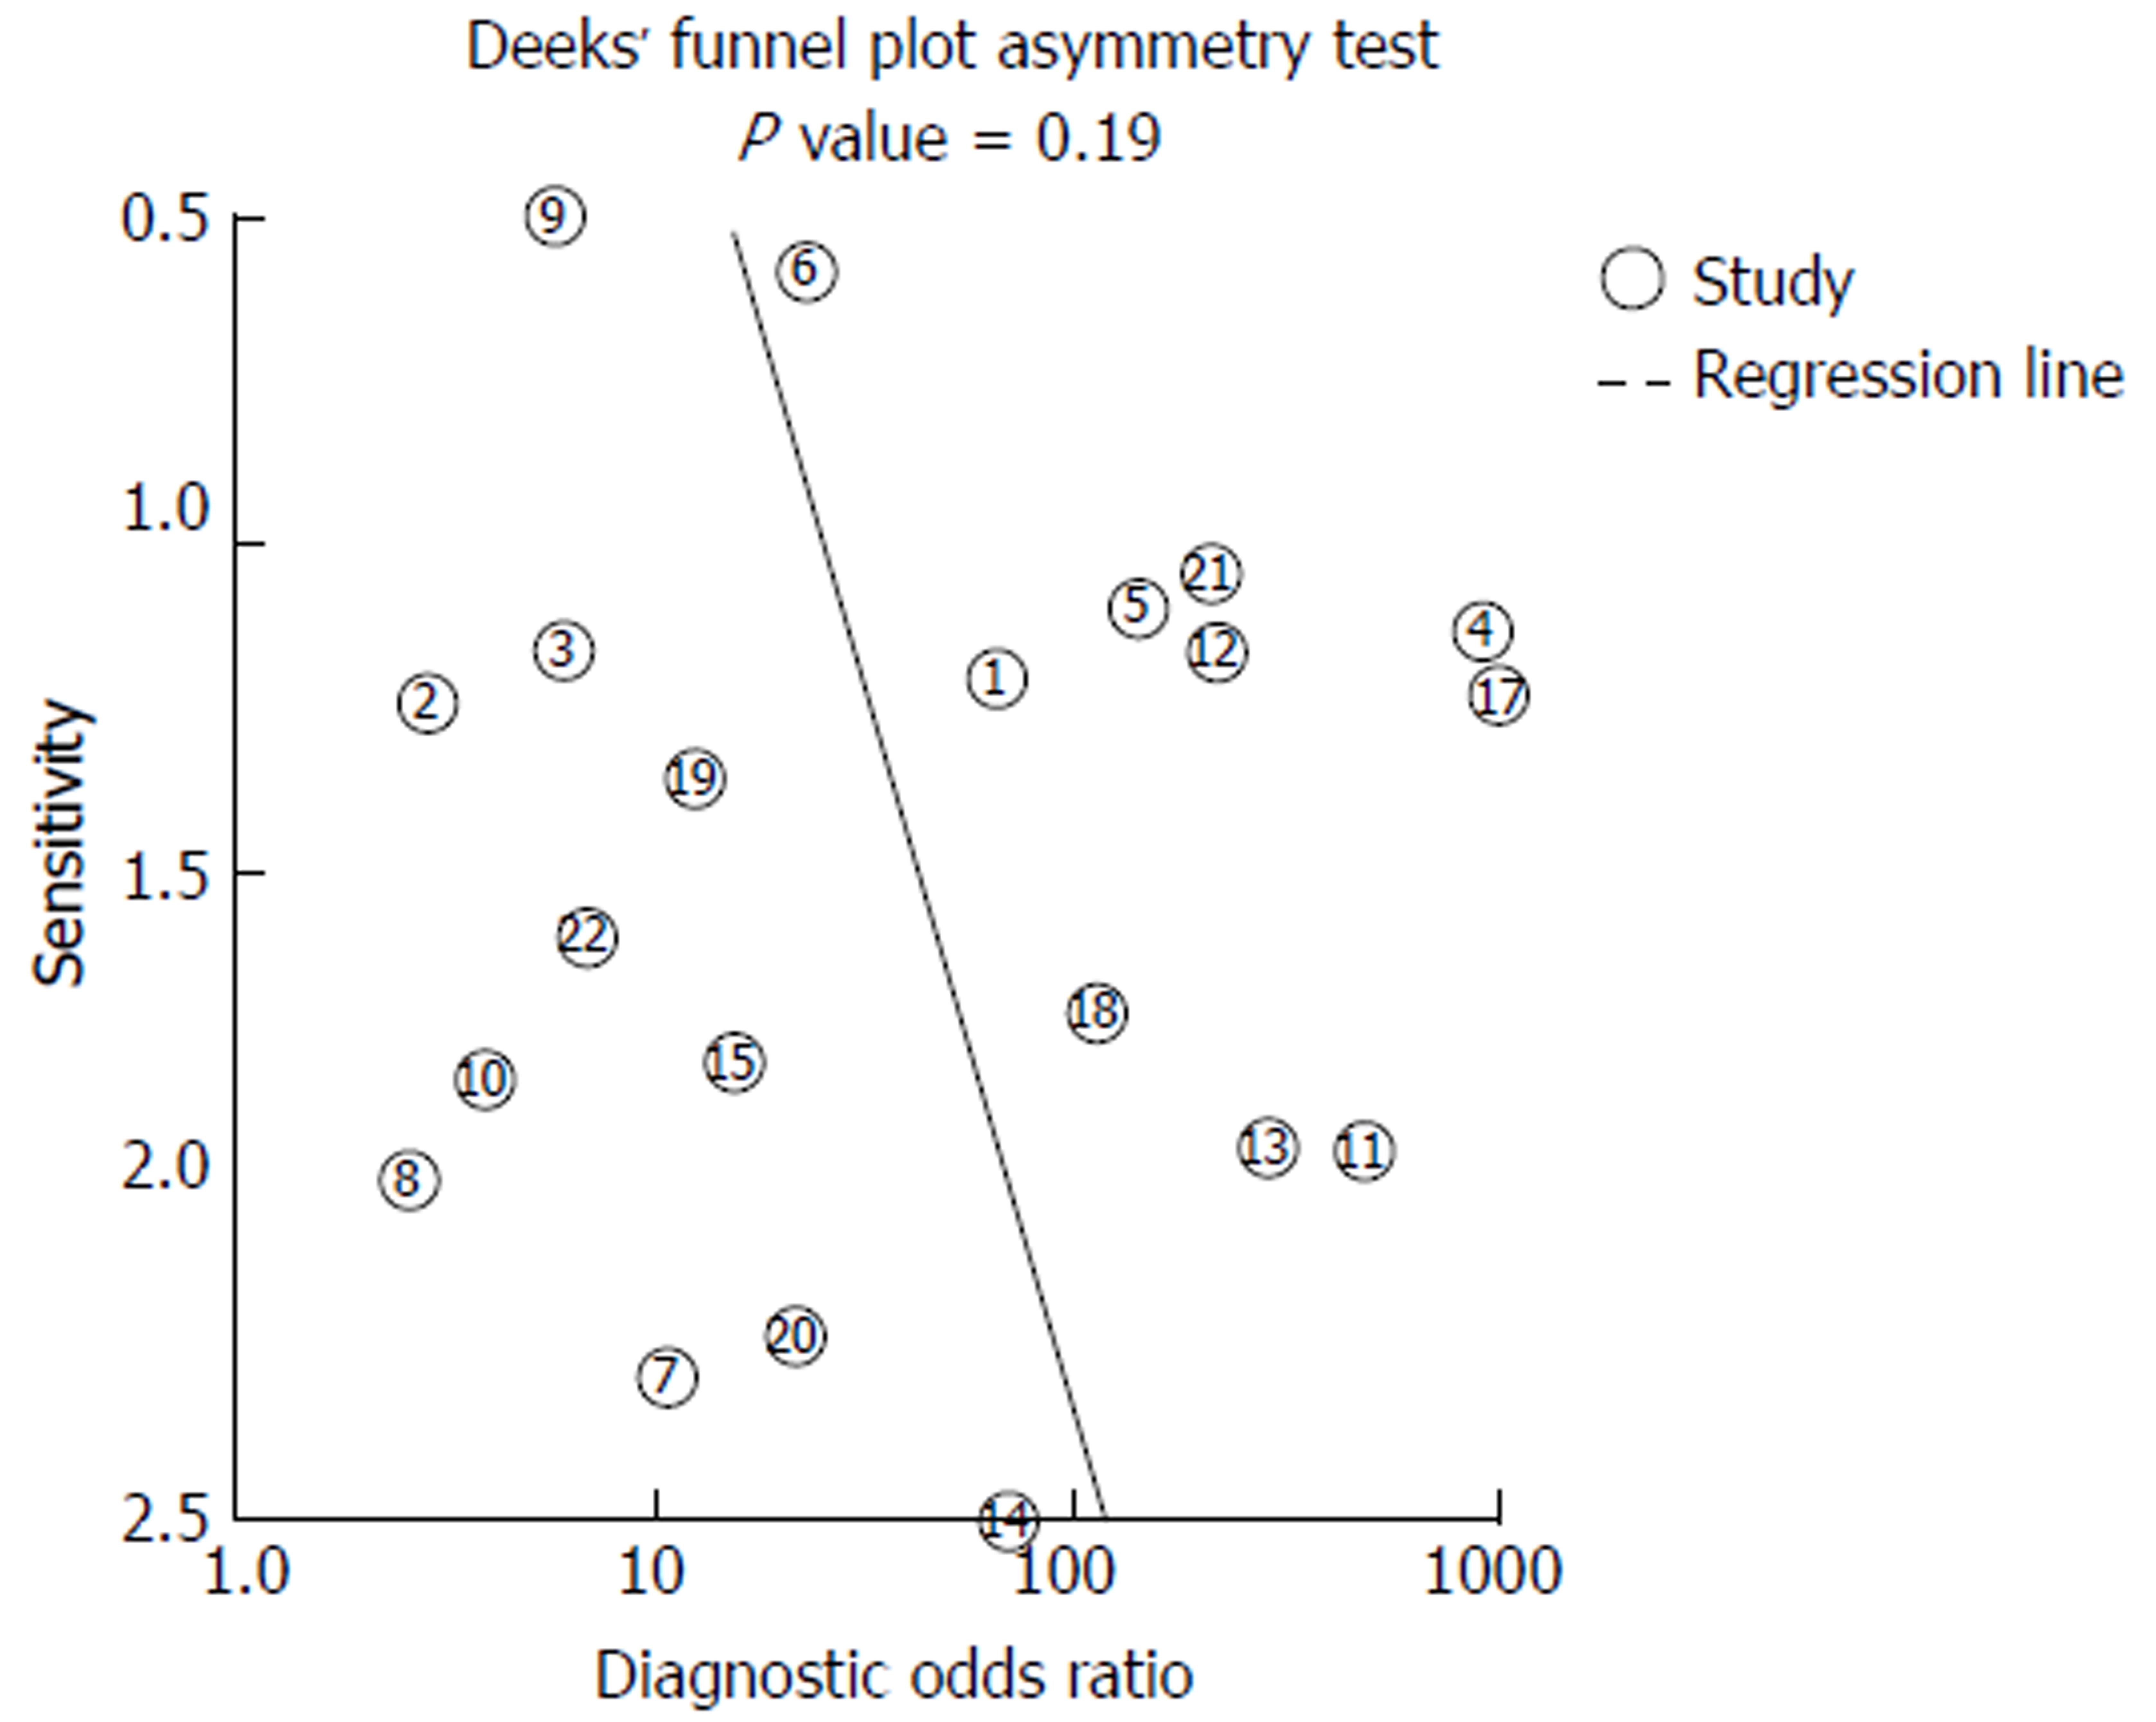
Figure 6 Funnel plot with superimposed regression line looking for publication bias.
- Citation: Lord R, Burr NE, Mohammed N, Subramanian V. Colonic lesion characterization in inflammatory bowel disease: A systematic review and meta-analysis. World J Gastroenterol 2018; 24(10): 1167-1180
- URL: https://www.wjgnet.com/1007-9327/full/v24/i10/1167.htm
- DOI: https://dx.doi.org/10.3748/wjg.v24.i10.1167


