Copyright
©The Author(s) 2018.
World J Gastroenterol. Mar 14, 2018; 24(10): 1107-1119
Published online Mar 14, 2018. doi: 10.3748/wjg.v24.i10.1107
Published online Mar 14, 2018. doi: 10.3748/wjg.v24.i10.1107
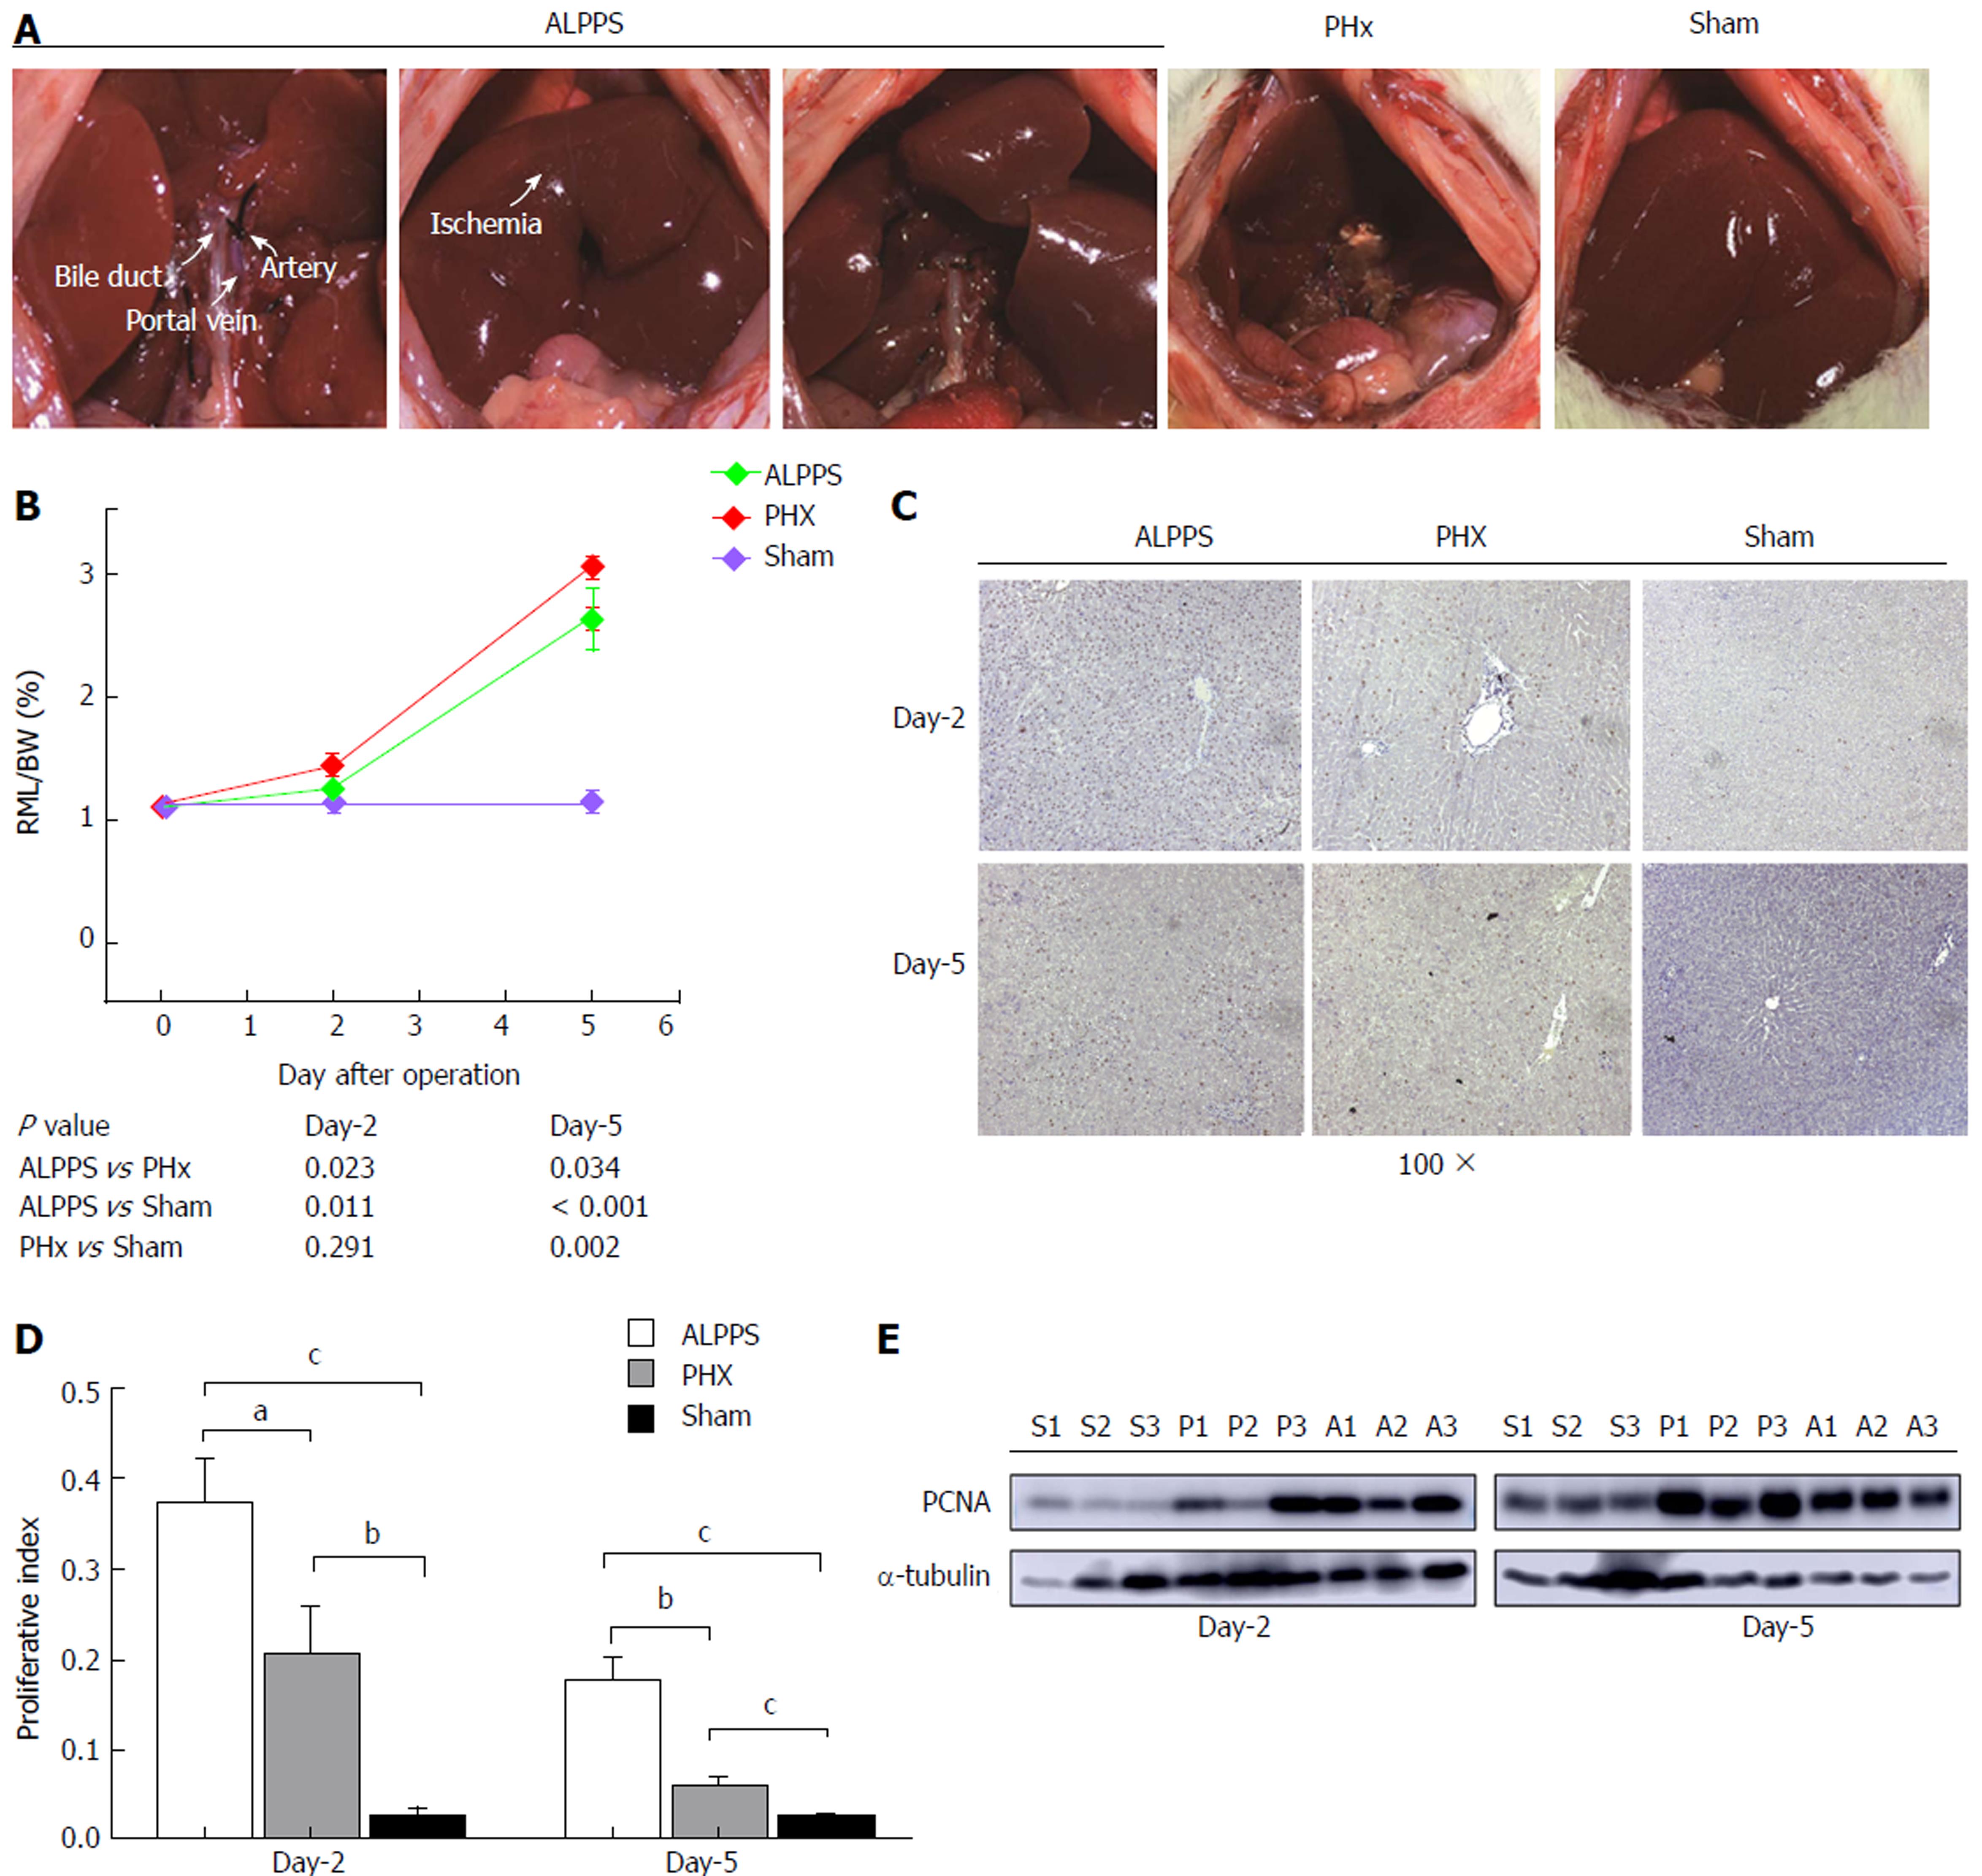
Figure 1 Establishment of ALPPS model.
A: Pictures of ALPPS, PHx, and sham models; B: Proliferation of ALPPS, PHx, and sham models. The X axis represented the day after operation while the Y axis represents the RML/WB (%); C: Representative image (100 ×) of Ki-67 stain by immunohistochemistry of each group at day 2 and 5, respectively; D: Proliferative index of different models, which was calculated by the mean of percentage of Ki-67 positive particle in four random visual fields (200×) of IHC stain. aP < 0.05, bP < 0.01, cP < 0.001; E: Protein level of represent expression of PCNA of each group. A: ALPPS; P/PHx: Partial hepatectomy; S: Sham; PCNA: Proliferating cell nuclear antigen; IHC: Immunohistochemistry; RML: Right middle lobe; WB: Body weight.
Figure 2 The role of hepatic progenitor cell in ALPPS.
A: The schematic of differentiation from hepatic progenitor cell to mature hepatocyte; B: Representative image (400 ×) of HE stain of each group at day 2 and 5, respectively; C: Relative mRNA expression of hepatic progenitor cell markers of each group; D: Immunofluorescence for expression of Sox9 in different groups. aP < 0.05, bP < 0.01, cP < 0.001.
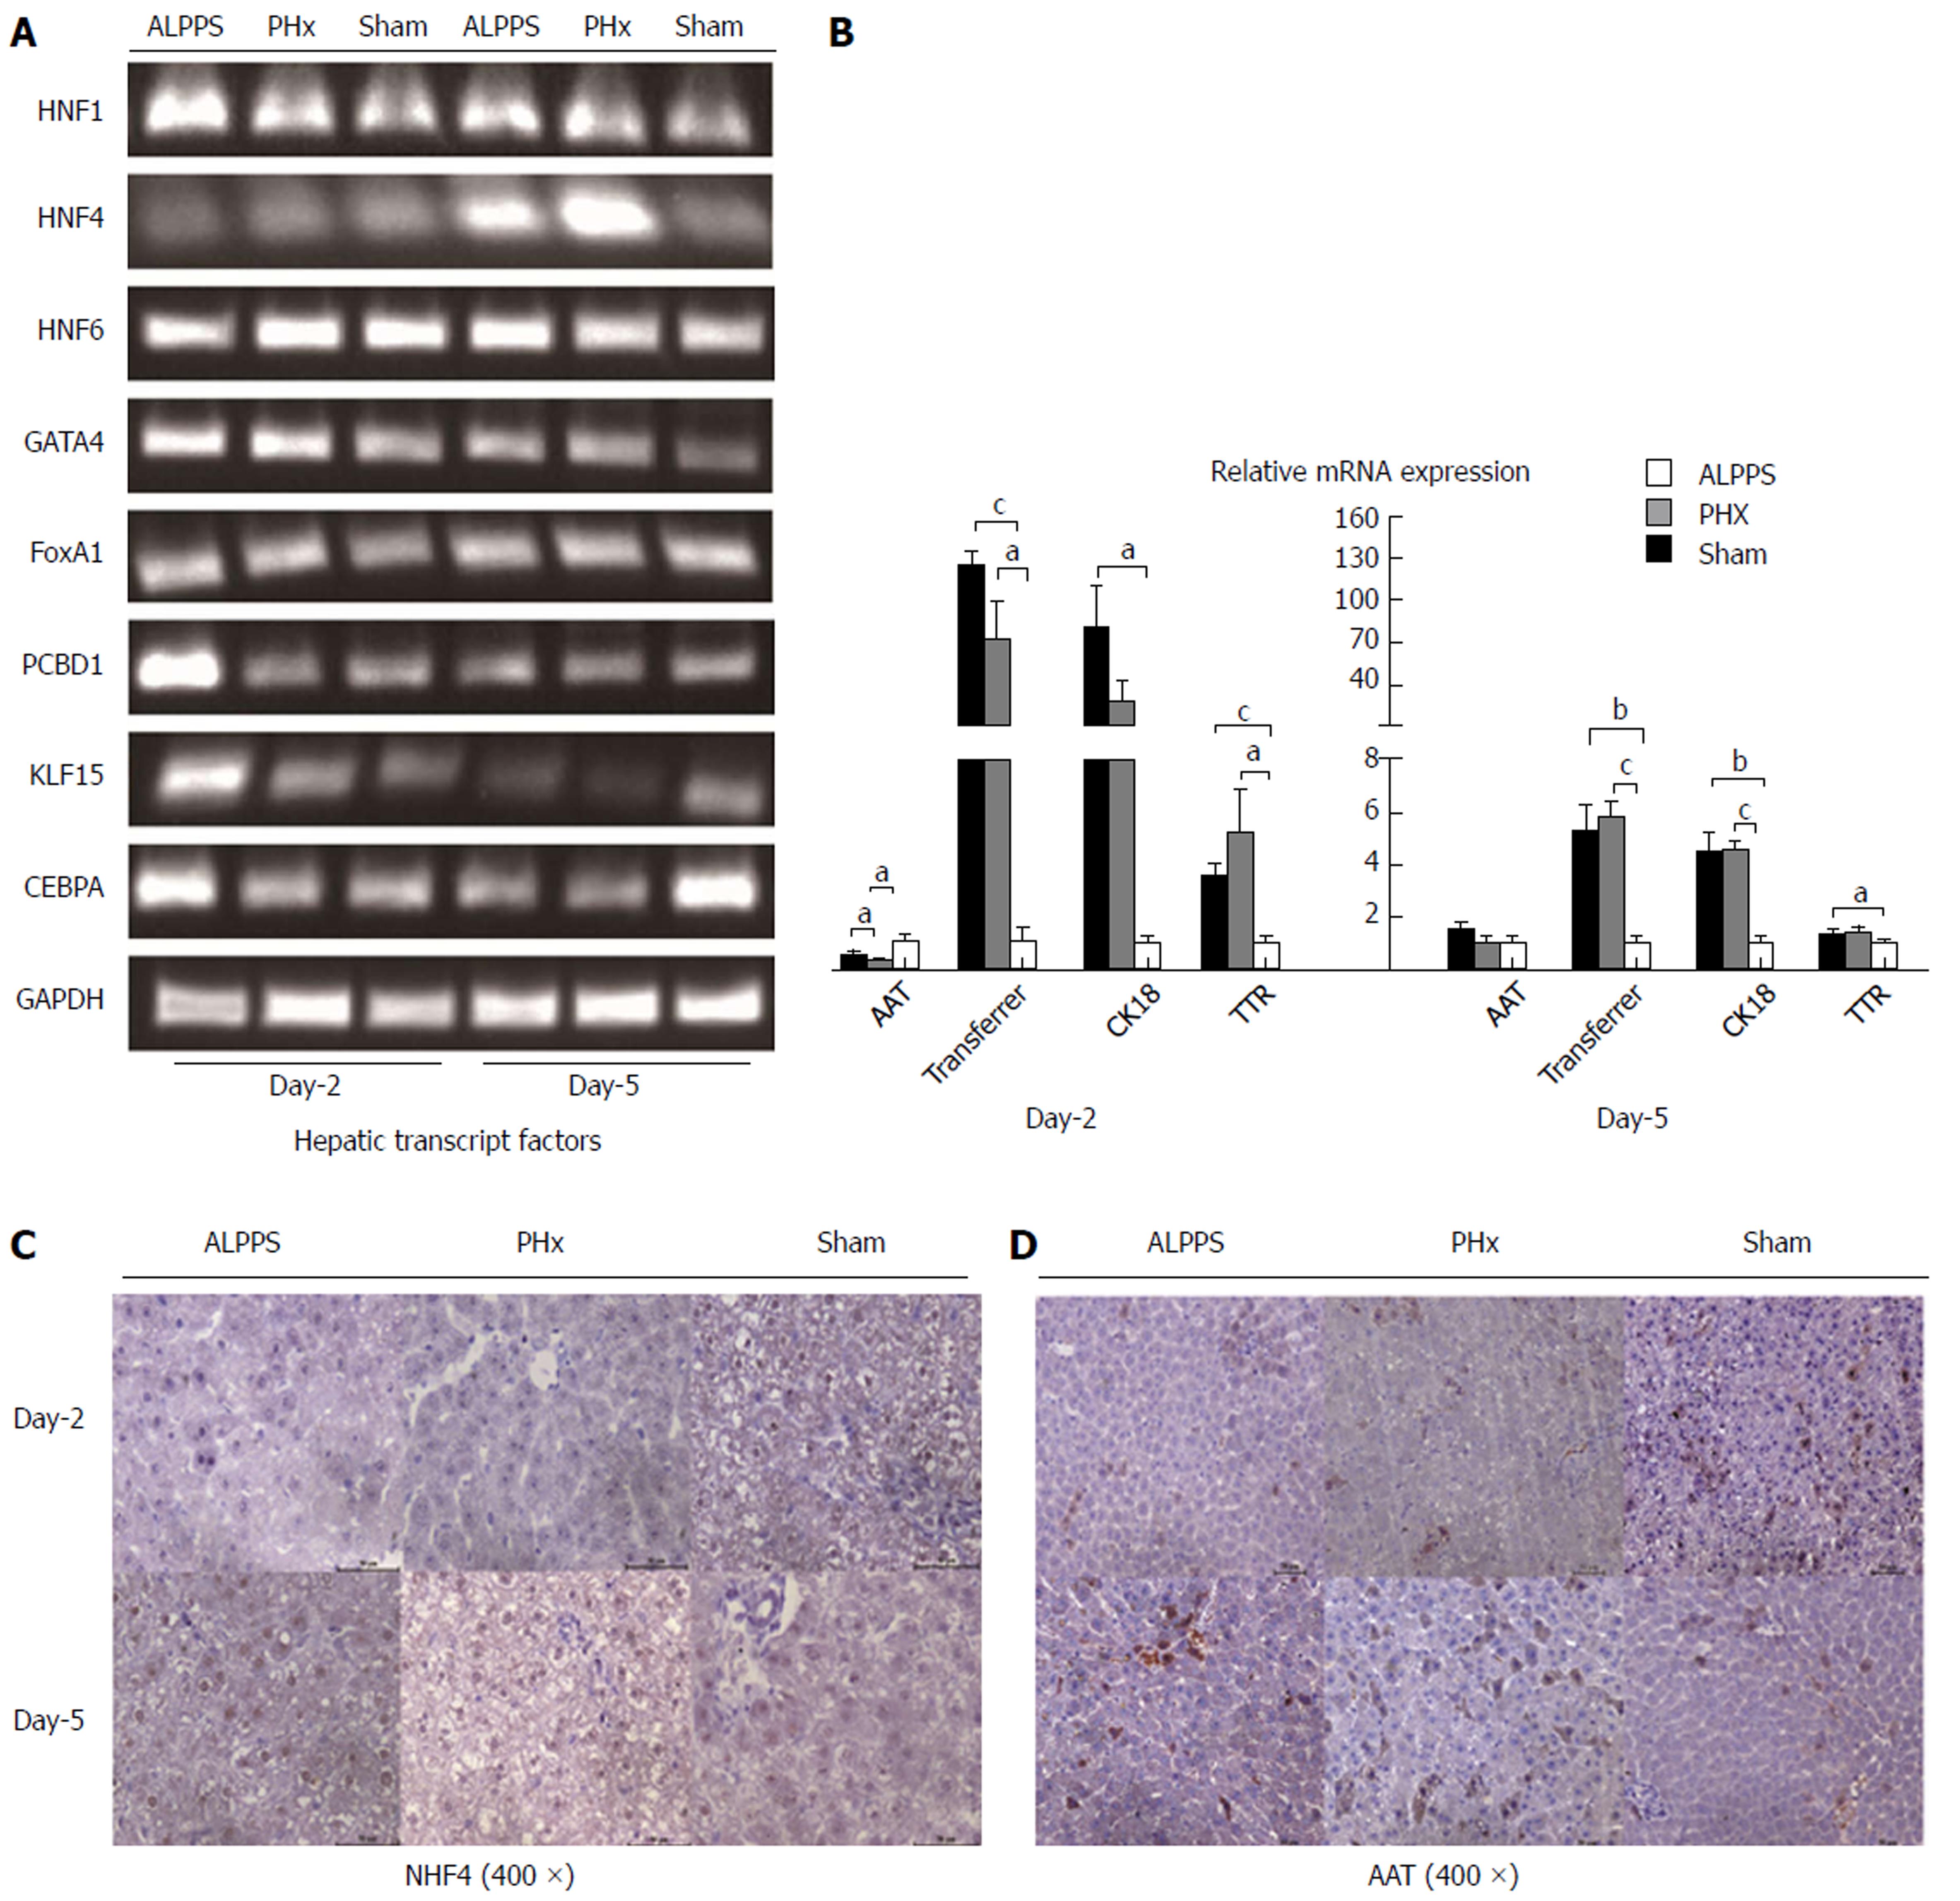
Figure 3 Characteristics of induced hepatocytes.
A: The expression of hepatic transcription factors in different groups at each time point at RNA level; B: Relative mRNA expression of mature hepatocyte markers; C: Detection of HNF4 and AAT content by immunohistochemistry procedure of each group at day 2 and 5, respectively. aP < 0.05, bP < 0.01, cP < 0.001.
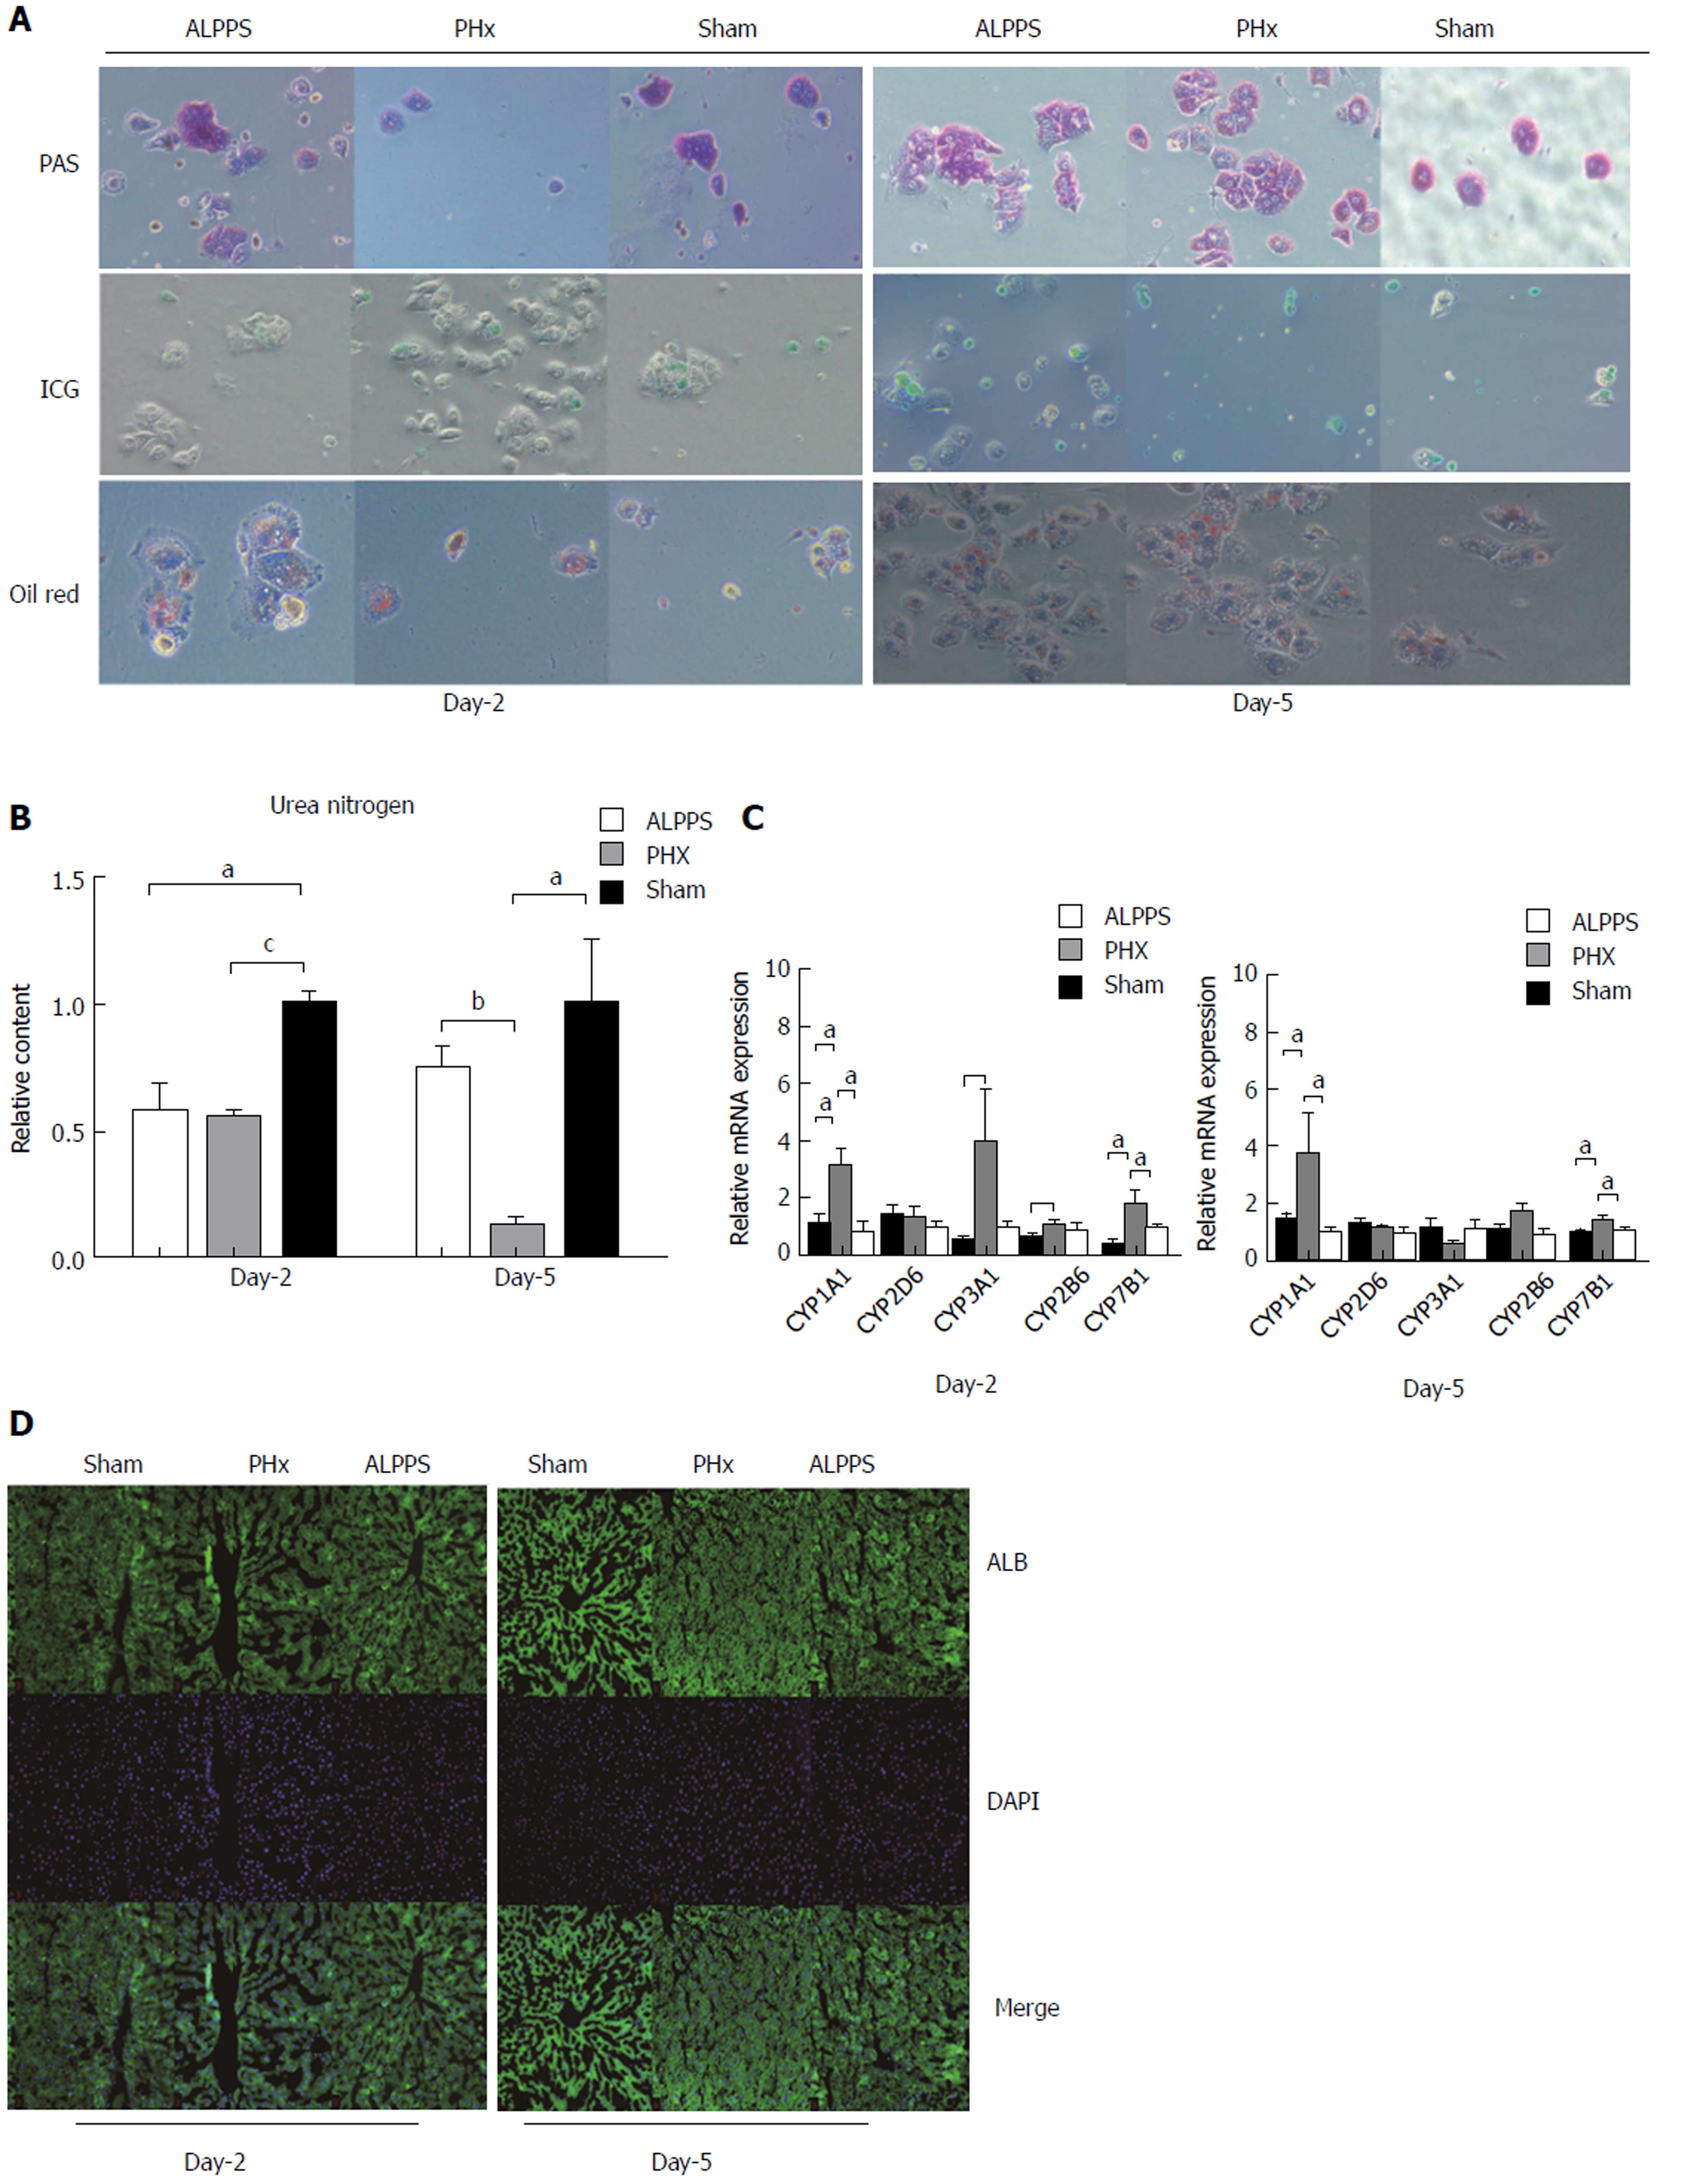
Figure 4 Hepatocytes function.
A: Glycogen storage was assayed by PAS staining; Fat storage was assayed by OilRed staining; ICG uptake in cells of different groups (green staining); B: P450Y enzymes expression at RNA level; C: The synthesis of Urea nitrogen of ALPPS, PHx, sham groups at each time point; D: The protein level of albumin expression was measured by Immunofluorescence. A: ALPPS; P/PHx: Partial hepatectomy; S: Sham. aP < 0.05, bP < 0.01, cP < 0.001.
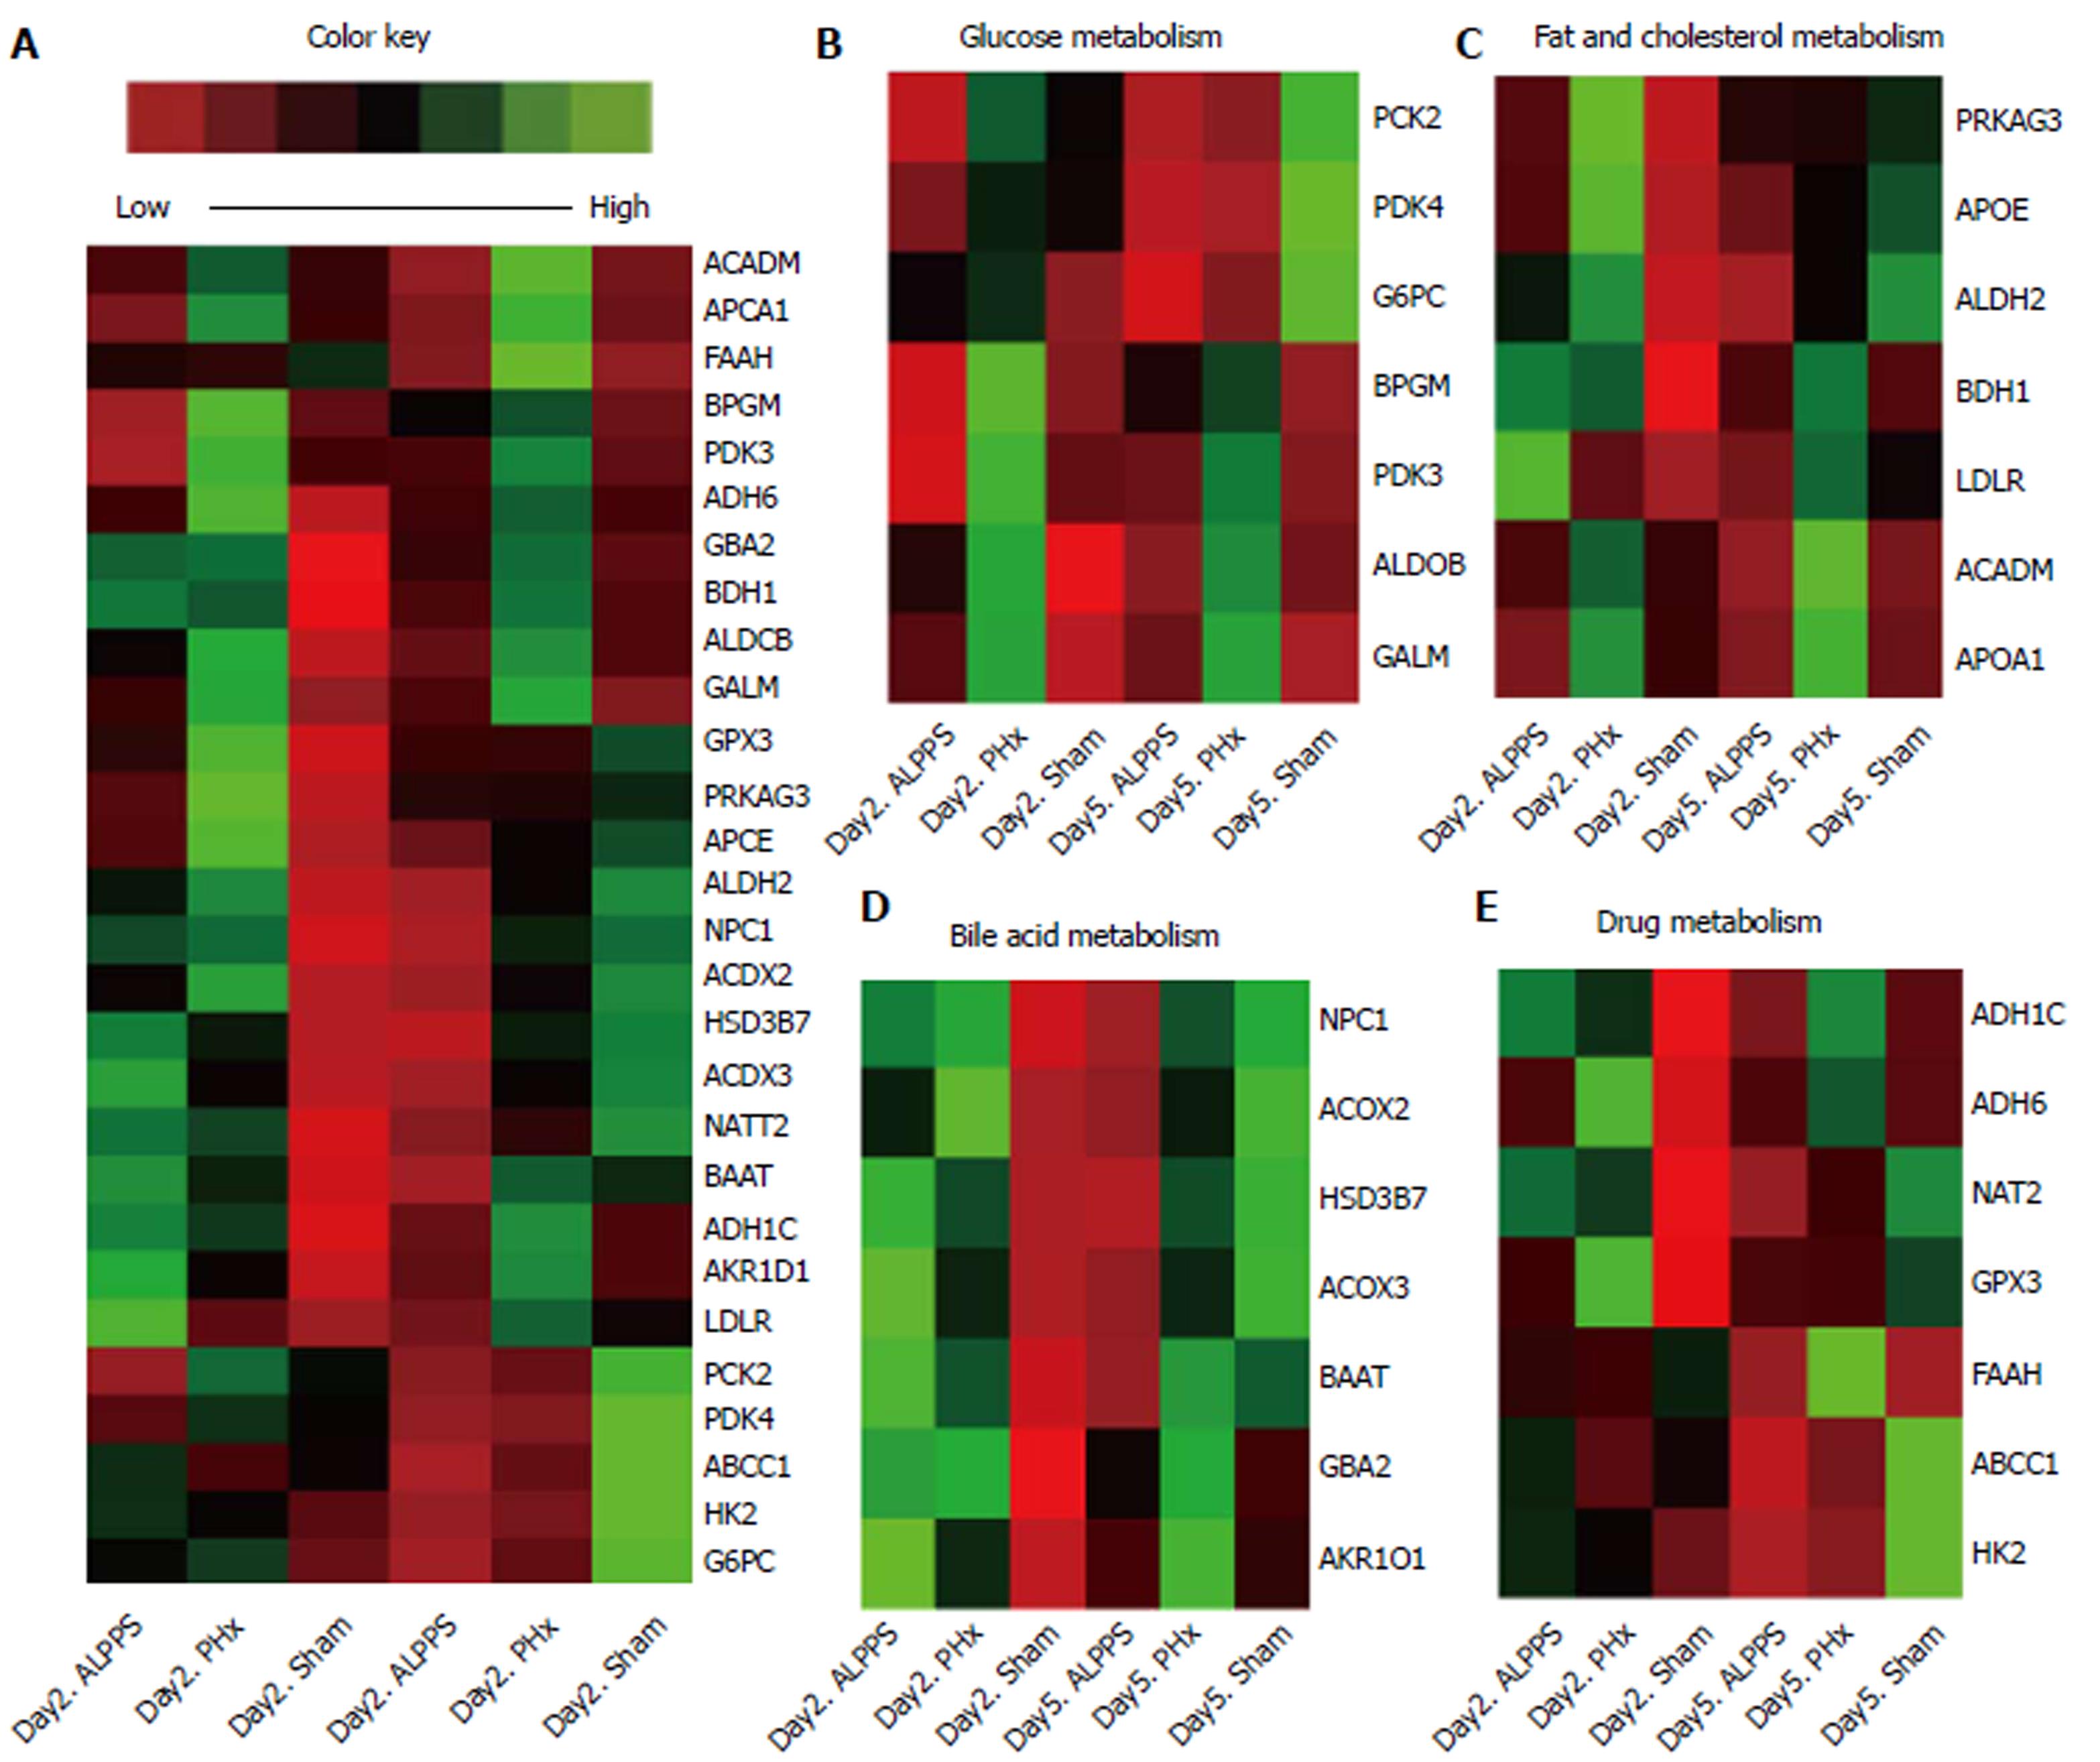
Figure 5 Cluster analysis of different expression of functional genes.
The color key represented the abundance expression of indicated genes (Compared with corresponding sham group at each time point). A: The overall cluster analysis of expression of functional genes; B: Glucose metabolism associated functional genes; C: Fat and cholesterol metabolism associated functional genes; D: Bile acid metabolism associated functional genes; E: Drug metabolism associated functional genes.
- Citation: Tong YF, Meng N, Chen MQ, Ying HN, Xu M, Lu B, Hong JJ, Wang YF, Cai XJ. Maturity of associating liver partition and portal vein ligation for staged hepatectomy-derived liver regeneration in a rat model. World J Gastroenterol 2018; 24(10): 1107-1119
- URL: https://www.wjgnet.com/1007-9327/full/v24/i10/1107.htm
- DOI: https://dx.doi.org/10.3748/wjg.v24.i10.1107


