Copyright
©The Author(s) 2017.
World J Gastroenterol. Feb 21, 2017; 23(7): 1310-1318
Published online Feb 21, 2017. doi: 10.3748/wjg.v23.i7.1310
Published online Feb 21, 2017. doi: 10.3748/wjg.v23.i7.1310
Figure 1 Selection process for studies included in the meta-analysis.
Figure 2 Forest plots of the hazard ratios for overall survival.
OS: Overall survival; IV: Inverse variance; df: Degrees of freedom.
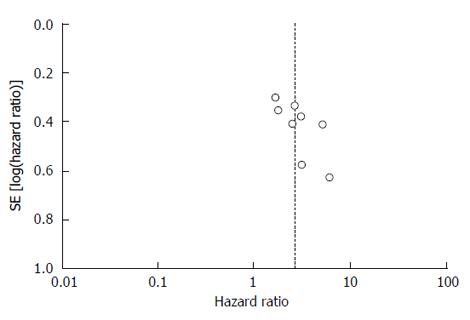
Figure 3 Funnel plot of the studies on overall survival.
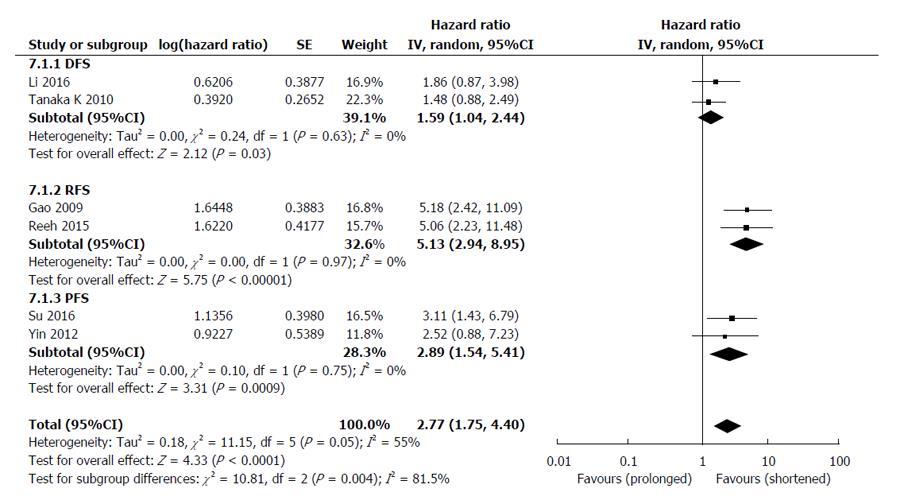
Figure 4 Forest plots of the hazard ratios for disease progression.
HRs: Hazard Ratios; DFS: Disease-Free Survival; PFS: Progression-Free Survival; RFS: Relapse-Free Survival; IV: Inverse variance; df: degrees of freedom.
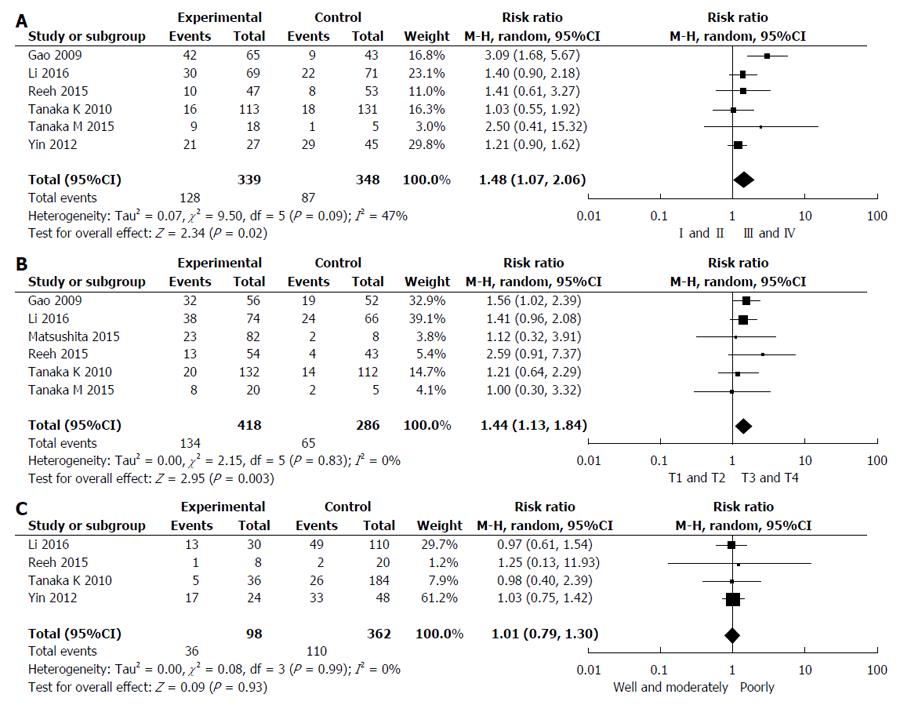
Figure 5 Forest plots of the RRs for clinicopathological characteristics.
A: TNM stage; B: T stage; C: Histological differentiation. RRs: Risk Rataios; M-H: Mantel-Haenszel; df: Degrees of freedom.
- Citation: Xu HT, Miao J, Liu JW, Zhang LG, Zhang QG. Prognostic value of circulating tumor cells in esophageal cancer. World J Gastroenterol 2017; 23(7): 1310-1318
- URL: https://www.wjgnet.com/1007-9327/full/v23/i7/1310.htm
- DOI: https://dx.doi.org/10.3748/wjg.v23.i7.1310


