Copyright
©The Author(s) 2017.
World J Gastroenterol. Feb 7, 2017; 23(5): 810-816
Published online Feb 7, 2017. doi: 10.3748/wjg.v23.i5.810
Published online Feb 7, 2017. doi: 10.3748/wjg.v23.i5.810
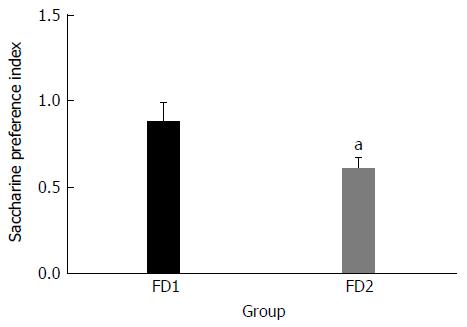
Figure 1 Saccharine preference index of the normal group (FD1) and the model group (FD2).
The data are presented as mean ± SE. aP < 0.01 vs the normal group.
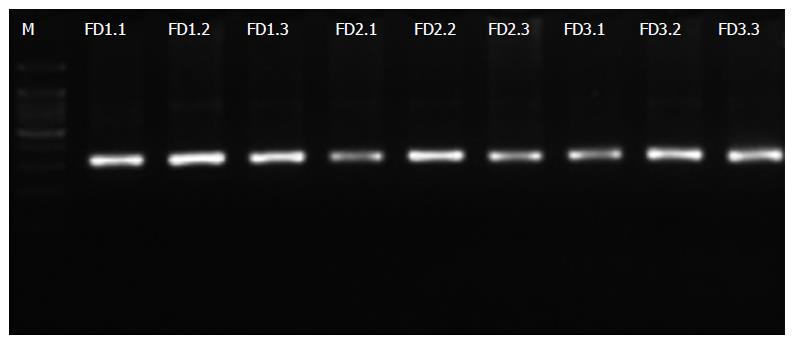
Figure 2 Agarose gel electrophoresis of PCR products of the V4 region of 16S rDNA.
Normal group: FD (1.1-1.3); Model group: FD (2.1-2.3); Xiaoyaosan group: FD (3.1-3.3). FD: Functional dyspepsia.
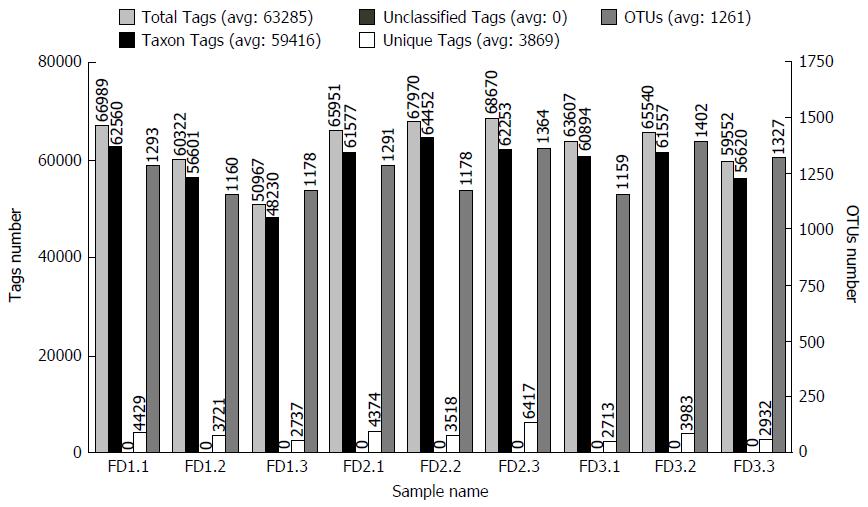
Figure 3 Statistical graph of Tags and Operational Taxonomic Unit clustering.
Normal group: FD (1.1-1.3); Model group: FD (2.1-2.3); Xiaoyaosan group: FD (3.1-3.3). Total Tags: Effective Tags; Unique Tags: Uneffective Tags; Taxon Tags: Annotated Tags for OTUs; Unclassified Tags: Unannotated Tags. OTUs: Operational Taxonomic Units; FD: Functional dyspepsia.
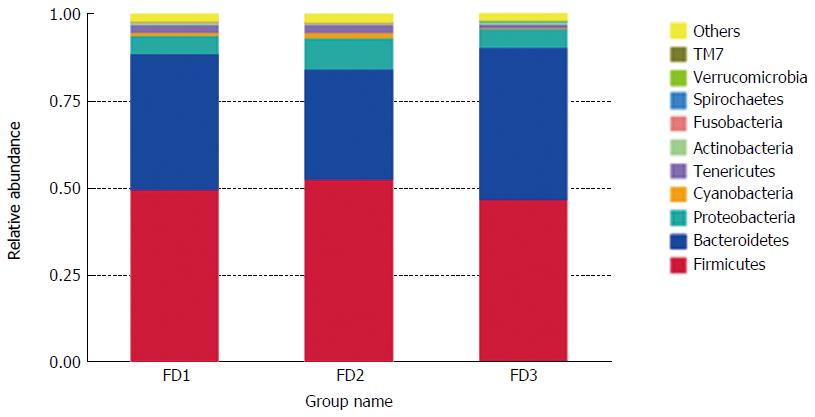
Figure 4 Relative abundance of the microbiomes at the phylum level.
Normal group: FD1; Model group: FD2; Xiaoyaosan group: FD3. FD: Functional dyspepsia.
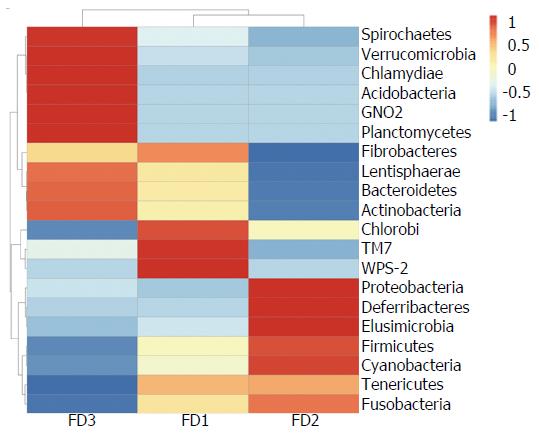
Figure 5 Heat map of species abundance clustering at the phylum level.
Normal group: FD1; Model group: FD2; Xiaoyaosan group: FD3. FD: Functional dyspepsia.
- Citation: Qiu JJ, Liu Z, Zhao P, Wang XJ, Li YC, Sui H, Owusu L, Guo HS, Cai ZX. Gut microbial diversity analysis using Illumina sequencing for functional dyspepsia with liver depression-spleen deficiency syndrome and the interventional Xiaoyaosan in a rat model. World J Gastroenterol 2017; 23(5): 810-816
- URL: https://www.wjgnet.com/1007-9327/full/v23/i5/810.htm
- DOI: https://dx.doi.org/10.3748/wjg.v23.i5.810


