Copyright
©The Author(s) 2017.
World J Gastroenterol. Oct 7, 2017; 23(37): 6845-6853
Published online Oct 7, 2017. doi: 10.3748/wjg.v23.i37.6845
Published online Oct 7, 2017. doi: 10.3748/wjg.v23.i37.6845
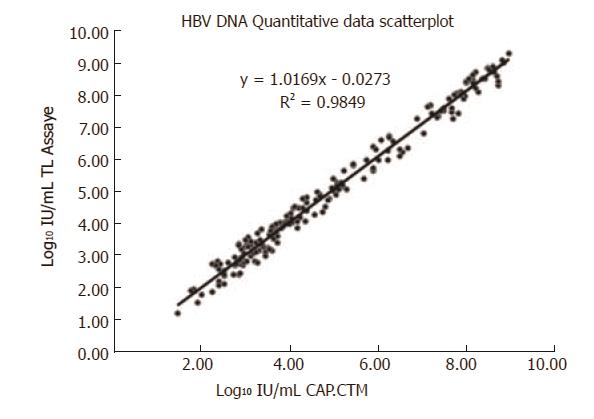
Figure 1 The correlation of measured hepatitis B virus DNA concentrations between the TL system assay and the CAP/CTM assay.
HBV: Hepatitis B virus.
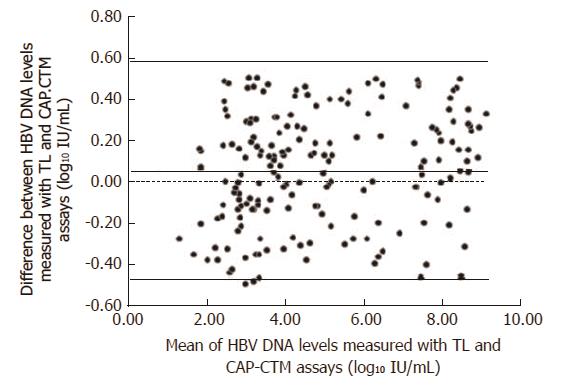
Figure 2 The difference of measured hepatitis B virus DNA concentrations between the TL system assay and the CAP/CTM assay.
HBV: Hepatitis B virus.
Figure 3 Linear correlation test standard curve.
HBV: Hepatitis B virus.
- Citation: Li M, Chen L, Liu LM, Li YL, Li BA, Li B, Mao YL, Xia LF, Wang T, Liu YN, Li Z, Guo TS. Performance verification and comparison of TianLong automatic hypersensitive hepatitis B virus DNA quantification system with Roche CAP/CTM system. World J Gastroenterol 2017; 23(37): 6845-6853
- URL: https://www.wjgnet.com/1007-9327/full/v23/i37/6845.htm
- DOI: https://dx.doi.org/10.3748/wjg.v23.i37.6845


