Copyright
©The Author(s) 2017.
World J Gastroenterol. Oct 7, 2017; 23(37): 6817-6832
Published online Oct 7, 2017. doi: 10.3748/wjg.v23.i37.6817
Published online Oct 7, 2017. doi: 10.3748/wjg.v23.i37.6817
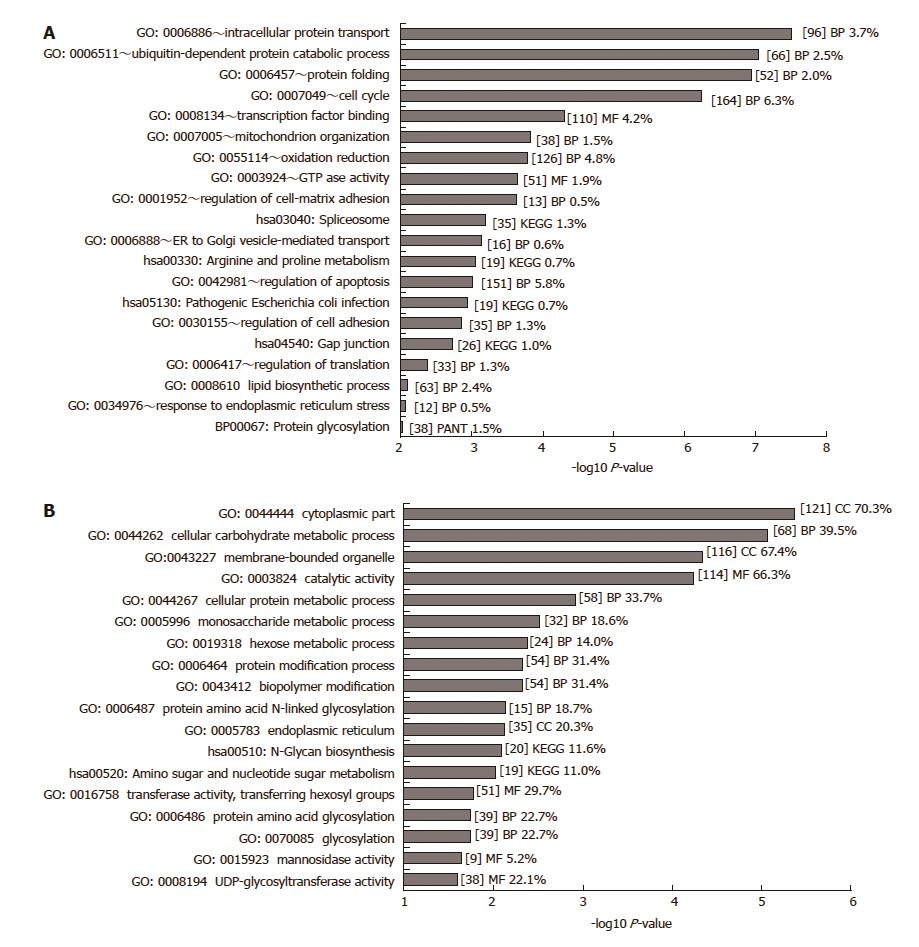
Figure 1 GO analysis of significant differentially expressed genes.
A: GO analysis of 2639 genes deemed significantly differentially expressed (P < 0.01, fold change > 1.2) was carried out in DAVID. Only GO terms with a P-value below 0.01 are shown (-log10 P-value > 2). GO terms were excluded where the number of genes belonging to that GO term exceeded 10% of all genes. B: GO analysis of 374 significantly differentially expressed glycosylation-related genes (P < 0.001) was carried out in DAVID. Only GO terms with a P-value below 0.1 are shown (-log10 P-value > 1). Some Panther (PANT) gene ontology and KEGG pathway terms were included from the DAVID analysis. The number of genes included in each term is given within square brackets [ ] together with the percentage of significant genes relative to the total number of genes of that term on the array. BP: Biochemical process; MF: Molecular function; CC: Cellular component.
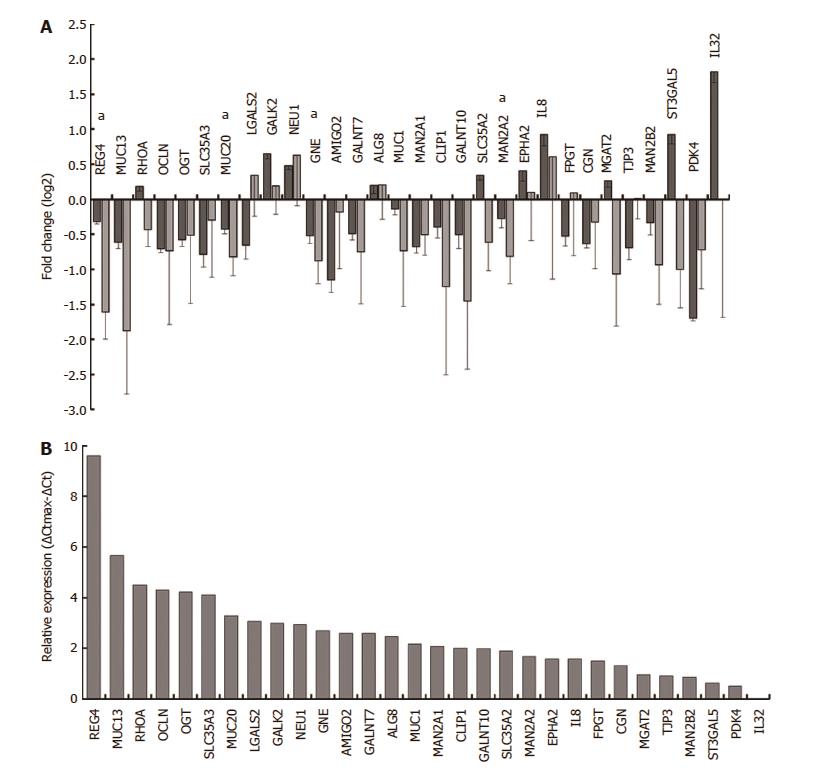
Figure 3 qRT-PCR validation of selected genes.
Differential expression of selected genes upon Helicobacter pylori (H. pylori) infection of E12 cells was compared between microarray (dark grey) and qRT-PCR (light grey) analyses. qRT-PCR validation was carried out on RNAs from samples collected independently of the microarray samples. A: Microarray data (n = 3) was normalised across samples with GeneSpring. qRT-PCR data (n = 3) were normalised using geNorm and a panel of three housekeeping genes. Error bars show standard deviations determined using propagation of error rules; B: Relative expression of each gene in uninfected E12 cells was estimated by qRT-PCR using ΔCt determinations. ΔCtmax was the ΔCt for the lowest expressing gene (IL32) after correcting Ct values across samples with the housekeeping gene GAPDH. Further details are given in Materials and Methods. All genes were significantly differentially expressed in microarray analysis and genes marked with asterisks (a) were confirmed significant by qRT-PCR.
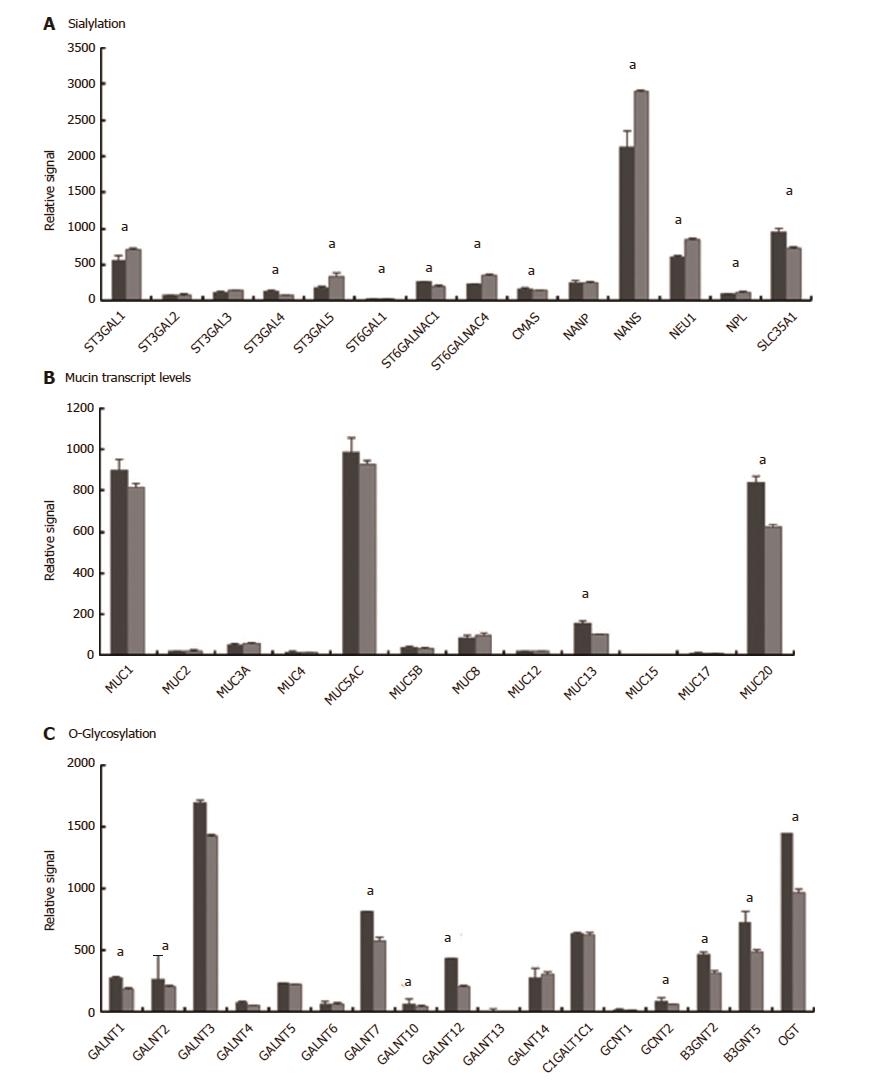
Figure 2 Transcript levels determined by microarray analysis of selected glycosylation related processes.
A: Sialylation-related genes; B: Mucin genes; C: O-glycosylation genes. Raw signals reported for each gene were the strongest signals where multiple probes were available (except for MUC2 where the negligible signal from the single probe, indicating very weak expression, was confirmed by qRT-PCR). All signals for uninfected samples were raw values whereas all infected samples were extracted using fold change values of normalised data as detailed in Materials and Methods. Uninfected (dark grey) or Infected (light grey). Error bars show standard deviations (n = 3). (aFDR < 0.05).
- Citation: Cairns MT, Gupta A, Naughton JA, Kane M, Clyne M, Joshi L. Glycosylation-related gene expression in HT29-MTX-E12 cells upon infection by Helicobacter pylori. World J Gastroenterol 2017; 23(37): 6817-6832
- URL: https://www.wjgnet.com/1007-9327/full/v23/i37/6817.htm
- DOI: https://dx.doi.org/10.3748/wjg.v23.i37.6817


