Copyright
©The Author(s) 2017.
World J Gastroenterol. Aug 21, 2017; 23(31): 5823-5828
Published online Aug 21, 2017. doi: 10.3748/wjg.v23.i31.5823
Published online Aug 21, 2017. doi: 10.3748/wjg.v23.i31.5823
Figure 1 Computed tomography and upper gastrointestinal endoscopy images.
A: CT imaging showed neither chronic liver disease nor splenomegaly before breast cancer surgery; B: Eight months after treatment with tegafur-uracil, CT imaging revealed the presence of massive ascites and splenomegaly; C: Upper gastrointestinal endoscopy showed grade 1 esophageal varices (arrowheads).
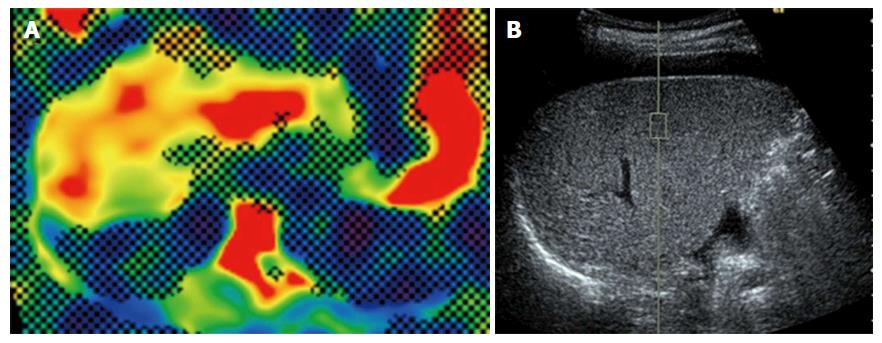
Figure 2 Magnetic resonance elastography and virtual touch quantification in the liver.
A: Elastography showed that the shear stiffness of the liver was 7.0 kPa; B: A region of interest was placed the right lobe and the median value of the measured shear wave velocity was 2.54 m/s.
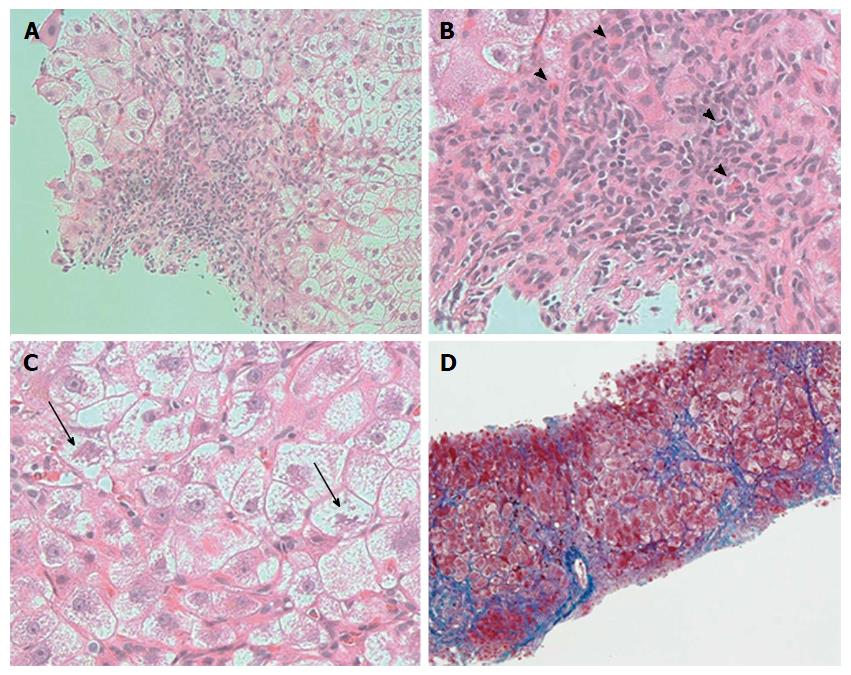
Figure 3 Histopathological analysis of the liver.
A: Histopathological examination showed interface hepatitis; B: Infiltration of lymphocytes, neutrophils, and eosinophils (arrowheads); C: Markedly ballooning of hepatocytes with Mallory bodies was observed (arrows) (hematoxylin-eosin staining, magnification A: × 200, B: × 400, C: × 400); D: Azan staining showed periportal fibrosis and bridging fibrosis with partial septation (Azan staining, magnification: × 100).
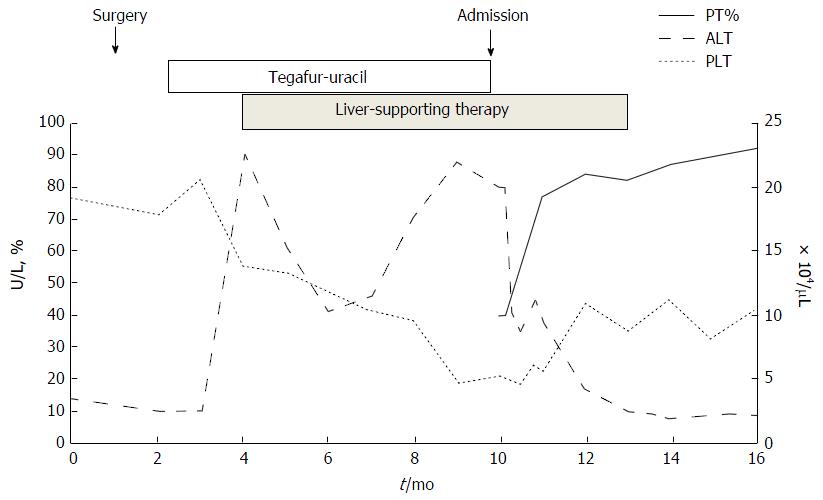
Figure 4 Clinical course.
Serum ALT levels increased after the administration of tegafur-uracil. With liver-supporting treatment, the serum ALT levels temporarily improved. However, serum ALT levels increased again, and the patient was referred to our hospital after 8 mo. Discontinuation of tegafur-uracil combined with conservative treatment improved serum ALT levels, platelet counts, and prothrombin activity. PT%: Prothrombin time; ALT: Alanine aminotransferase.
- Citation: Honda S, Sawada K, Hasebe T, Nakajima S, Fujiya M, Okumura T. Tegafur-uracil-induced rapid development of advanced hepatic fibrosis. World J Gastroenterol 2017; 23(31): 5823-5828
- URL: https://www.wjgnet.com/1007-9327/full/v23/i31/5823.htm
- DOI: https://dx.doi.org/10.3748/wjg.v23.i31.5823


