Copyright
©The Author(s) 2017.
World J Gastroenterol. Aug 21, 2017; 23(31): 5692-5699
Published online Aug 21, 2017. doi: 10.3748/wjg.v23.i31.5692
Published online Aug 21, 2017. doi: 10.3748/wjg.v23.i31.5692
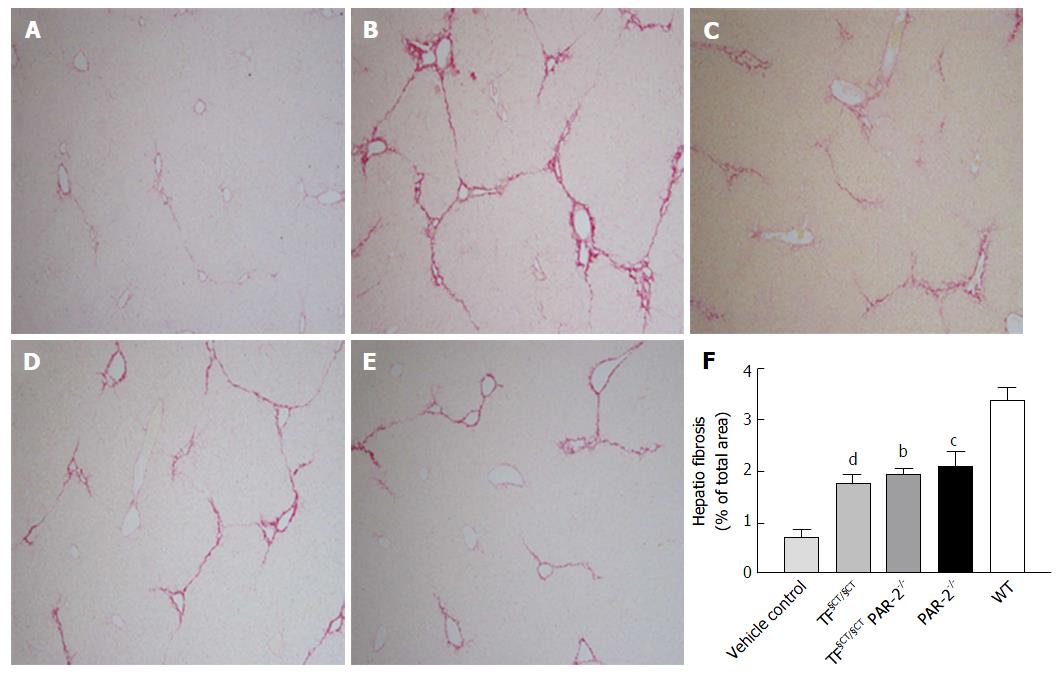
Figure 1 Hepatic fibrosis area.
Wildtype control mice administered vehicle alone showed minimal fibrosis (A). Compared to CCl4 treated wild-type mice (B), hepatic fibrosis area was significantly lower in the PAR-2-/- (C), TF§CT/§CT (D) and TF§CT/§CT/PAR-2-/- (E) mice after CCl4 exposure for 8 wk. (bP < 0.01, cP < 0.001 dP < 0.0001).
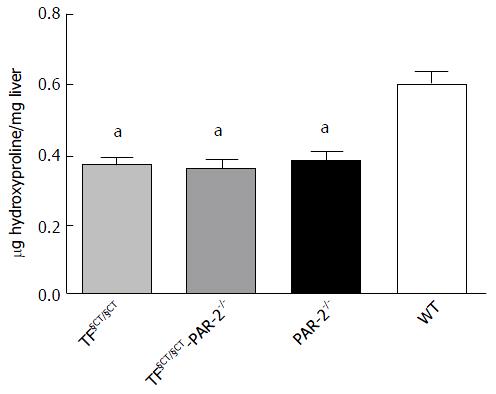
Figure 2 Hepatic hydroxyproline content.
Hydroxyproline content, a surrogate marker for collagen, was significantly less in the PAR-2-/-, TF§CT/§CT and TF§CT/§CT-PAR-2 KO mice compared to wildtype mice (aP < 0.05).
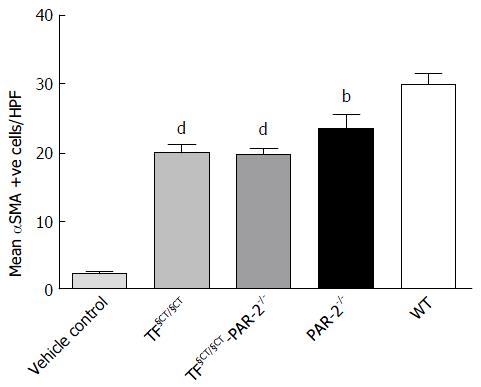
Figure 3 Hepatic stellate cell activation (smooth muscle actin expression).
The number of αSMA positive cells was significantly lower in the TF§CT/§CT and TF§CT/§CT/PAR-2-/- mice compared to wildtype and was similar to PAR-2 KO mice (bP < 0.01, dP < 0.0001).
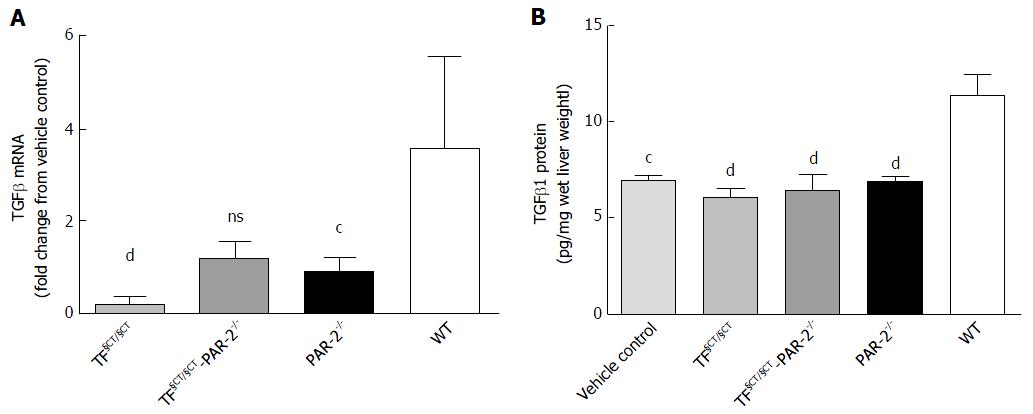
Figure 4 TGFβ mRNA and protein expression.
A: TGFβ mRNA expression was significantly lower in the TF§CT/§CT group with a similar but non-significant trend in TF§CT/§CT/PAR-2-/- mice compared to wildtype. Levels were similar to PAR-2 KO mice, which were also significantly lower than WT; B: TGFβ protein was significantly lower in TF§CT/§CT, TF§CT/§CT/PAR-2-/- and PAR-2-/- mice compared to wildtype with levels similar to vehicle controls. cP < 0.001, dP < 0.0001. ns: Not significant.
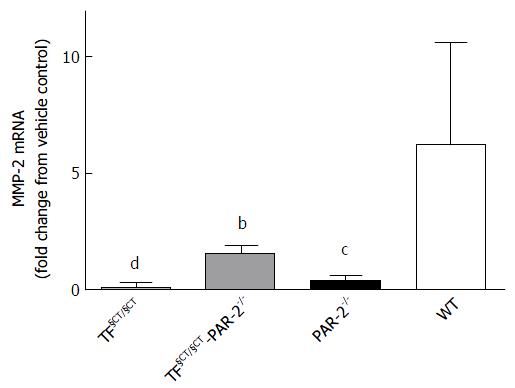
Figure 5 Matrix metalloproteinase expression.
MMP-2 mRNA expression was significantly lower in TF§CT/§CT, TF§CT/ §CT/PAR-2-/- and PAR-2-/- mice compared to wildtype. bP < 0.01, cP < 0.001, dP < 0.0001.
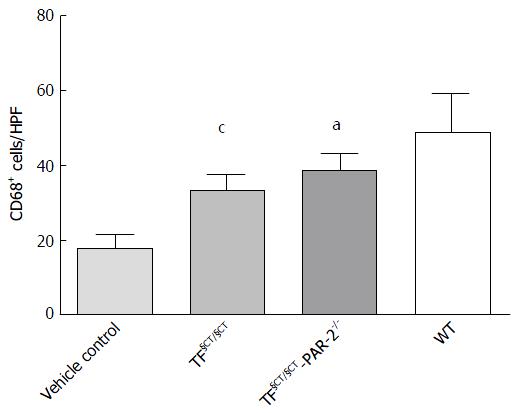
Figure 6 Hepatic macrophage expression.
There were significantly fewer activated CD68+ macrophages in both TF§CT/§CT and TF§CT/§CT/PAR-2-/- mice compared with WT mice. aP < 0.05, cP < 0.001.
- Citation: Knight V, Lourensz D, Tchongue J, Correia J, Tipping P, Sievert W. Cytoplasmic domain of tissue factor promotes liver fibrosis in mice. World J Gastroenterol 2017; 23(31): 5692-5699
- URL: https://www.wjgnet.com/1007-9327/full/v23/i31/5692.htm
- DOI: https://dx.doi.org/10.3748/wjg.v23.i31.5692


