Copyright
©The Author(s) 2017.
World J Gastroenterol. May 28, 2017; 23(20): 3730-3743
Published online May 28, 2017. doi: 10.3748/wjg.v23.i20.3730
Published online May 28, 2017. doi: 10.3748/wjg.v23.i20.3730
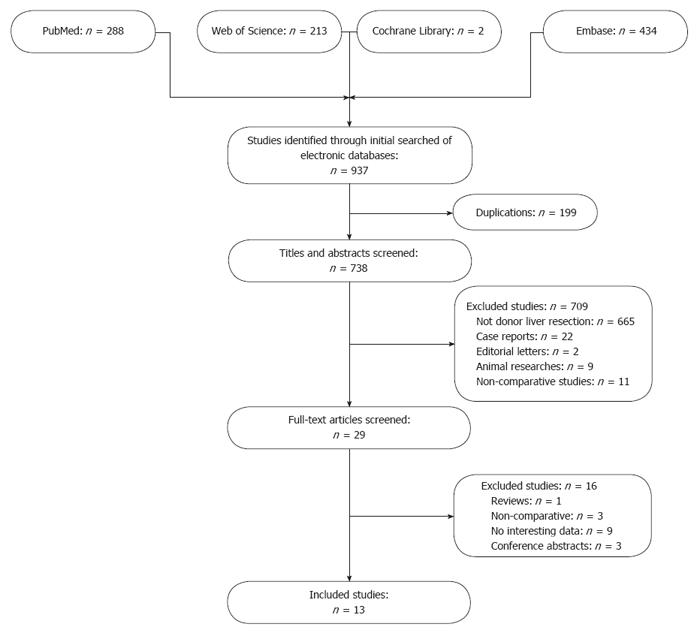
Figure 1 Flow diagram of study identification, inclusion and exclusion.
Figure 2 Forest plots and meta-analysis of intraoperative outcomes of donors.
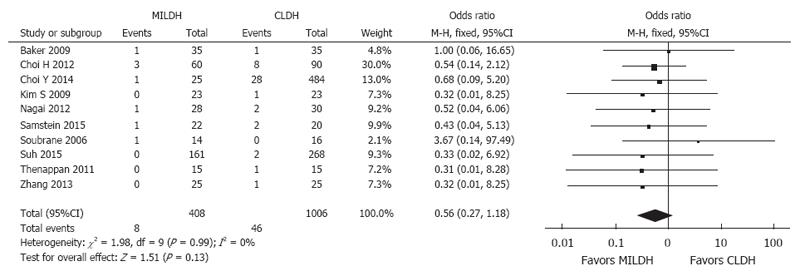
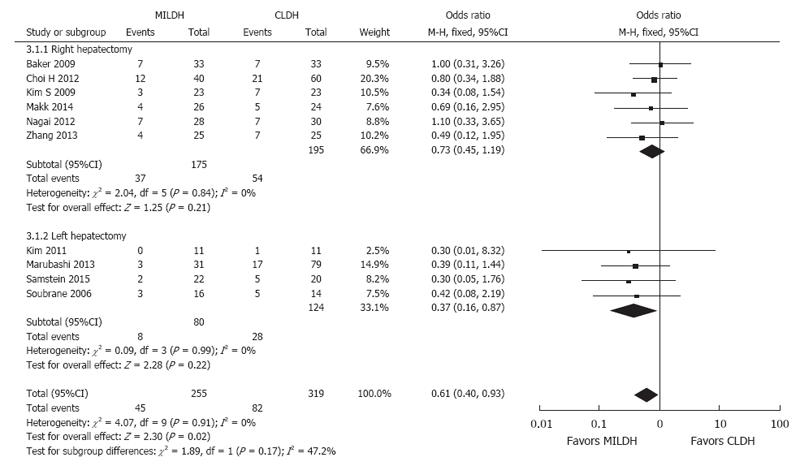
Figure 3 Forest plot and meta-analysis of postoperative biliary complications for donors.
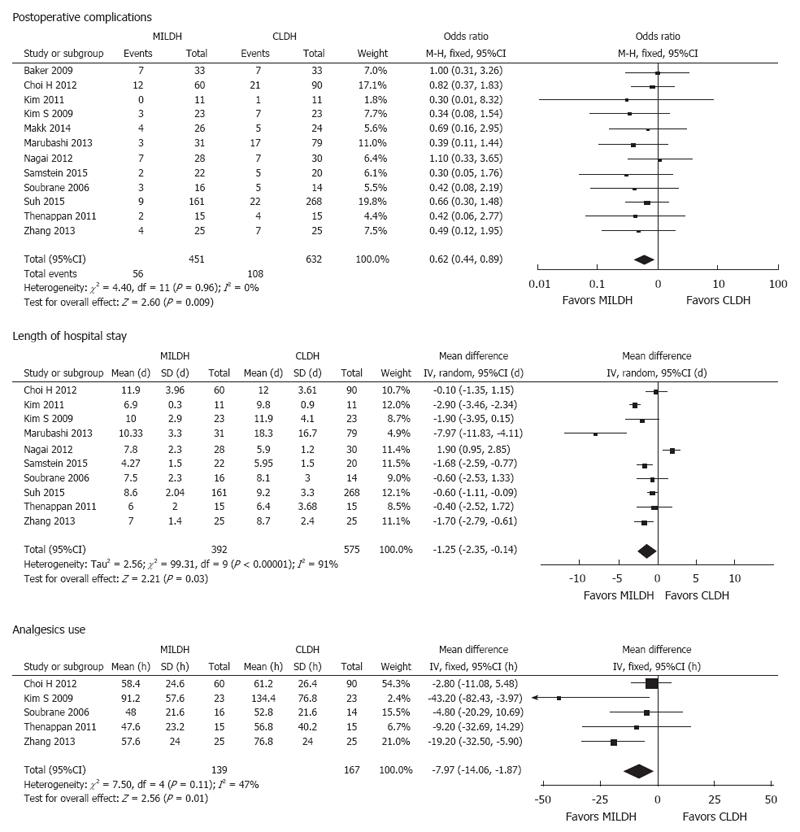
Figure 4 Forest plots and meta-analysis of postoperative outcomes of donors.
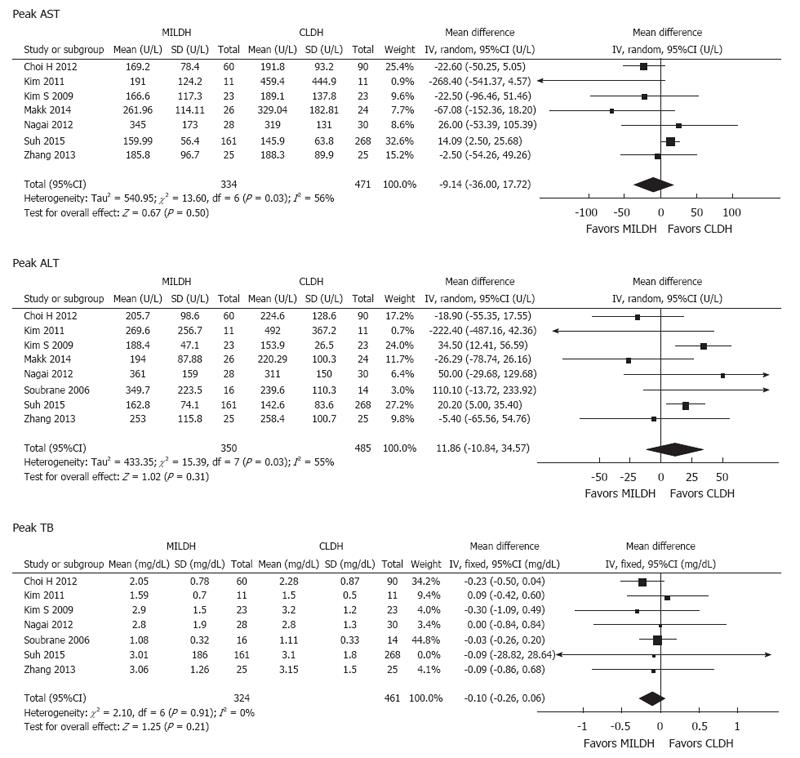
Figure 5 Forest plots and meta-analysis of postoperative liver function of donors.
Figure 6 Forest plot and meta-analysis of postoperative biliary complications for recipients.
Figure 7 Forest plots and meta-analysis of postoperative outcomes of recipients.
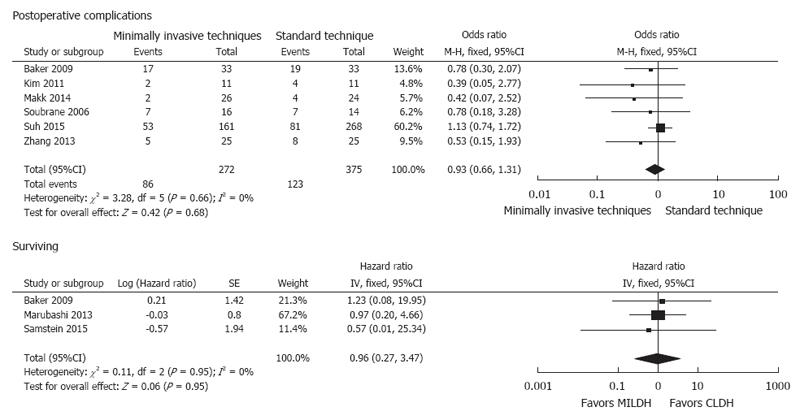
Figure 8 Forest plot and meta-analysis of postoperative complication rates for donors.
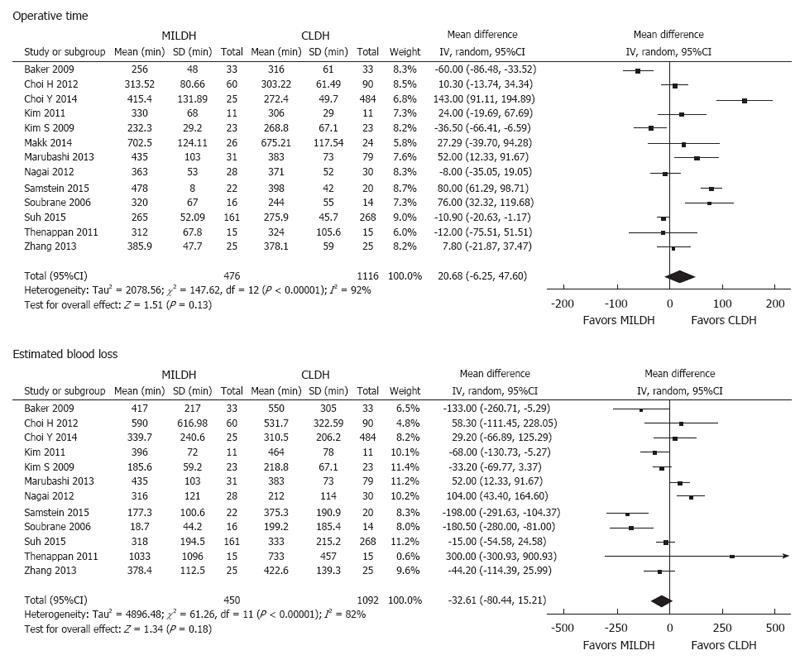
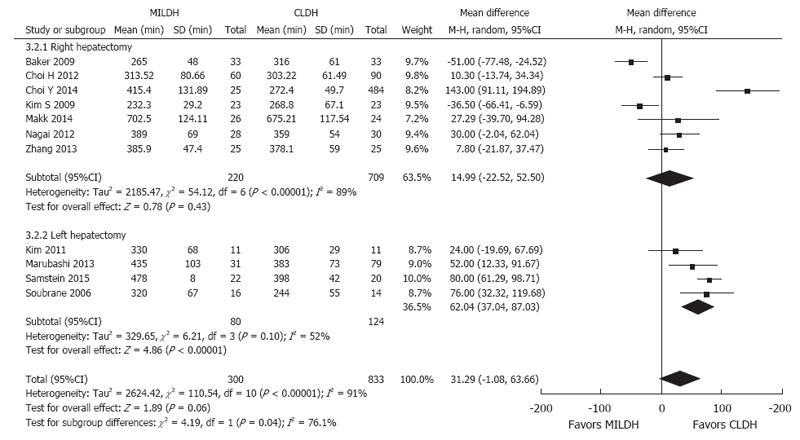
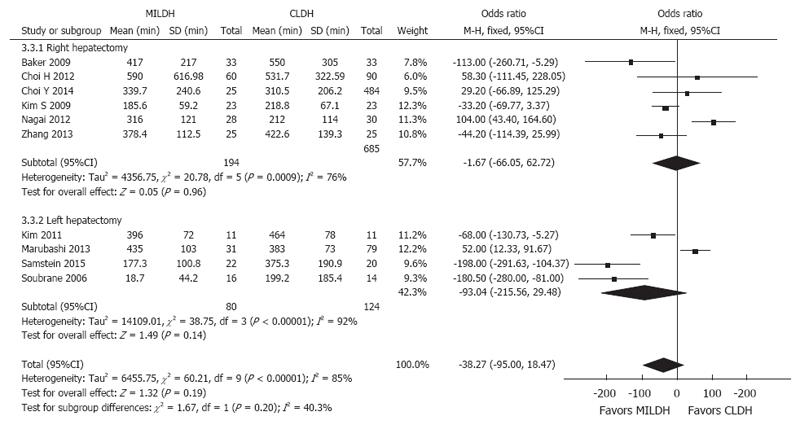
Figure 9 Forest plot and meta-analysis of operative time for donors.
Figure 10 Forest plot and meta-analysis of estimated blood loss for donors.
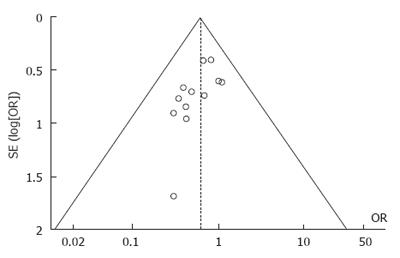
Figure 11 Funnel plot of postoperative complication rates.
- Citation: Li H, Zhang JB, Chen XL, Fan L, Wang L, Li SH, Zheng QL, Wang XM, Yang Y, Chen GH, Wang GS. Different techniques for harvesting grafts for living donor liver transplantation: A systematic review and meta-analysis. World J Gastroenterol 2017; 23(20): 3730-3743
- URL: https://www.wjgnet.com/1007-9327/full/v23/i20/3730.htm
- DOI: https://dx.doi.org/10.3748/wjg.v23.i20.3730


