Copyright
©The Author(s) 2017.
World J Gastroenterol. Mar 28, 2017; 23(12): 2234-2245
Published online Mar 28, 2017. doi: 10.3748/wjg.v23.i12.2234
Published online Mar 28, 2017. doi: 10.3748/wjg.v23.i12.2234
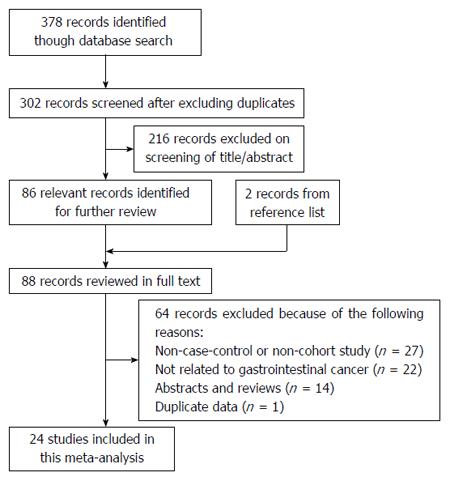
Figure 1 Flow chart of literature inclusion and exclusion.
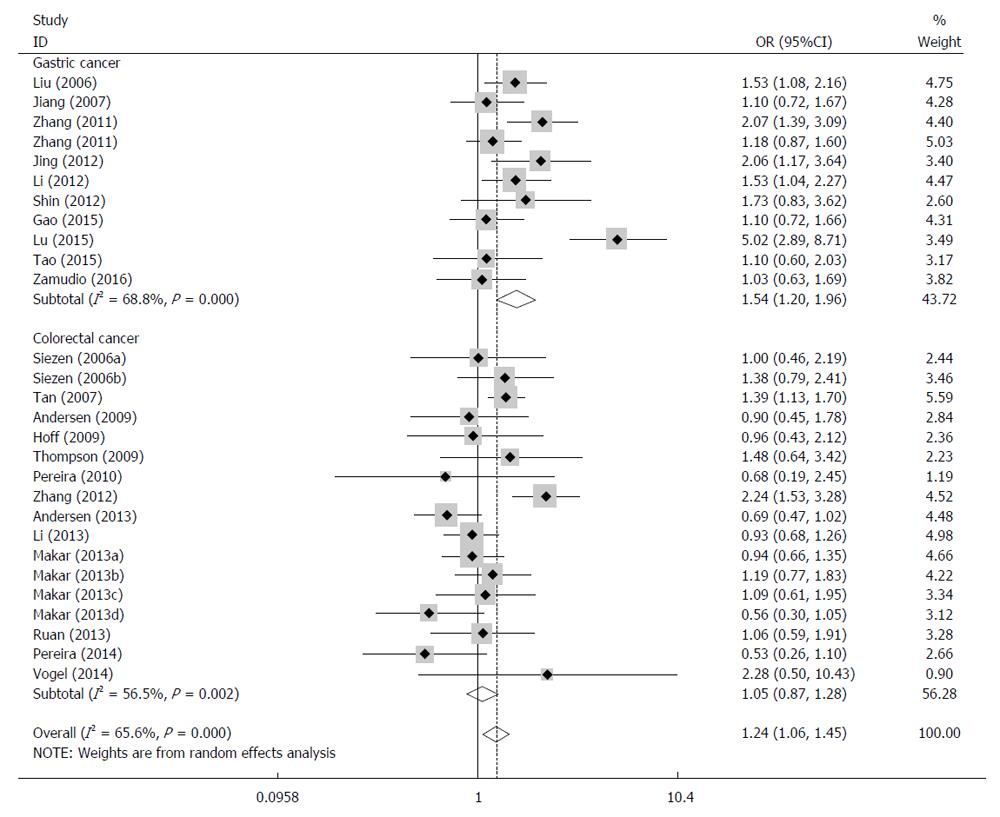
Figure 2 Forest plot of the stratified analysis of the COX-2 -1195G>A dominant model (AA/AG vs GG) and susceptibility to gastrointestinal cancers in different tumour types.
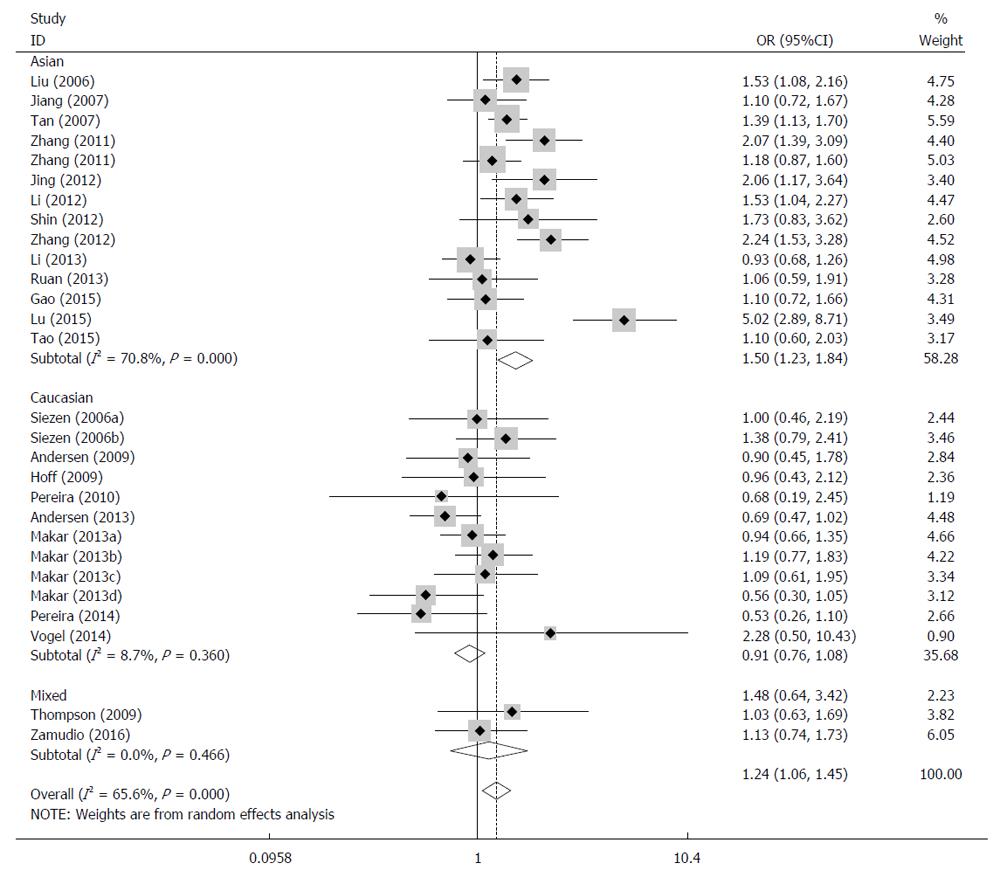
Figure 3 Forest plot of stratified analysis of the COX-2 -1195G>A dominant model (AA/AG vs GG) and gastrointestinal cancer susceptibility in different populations.
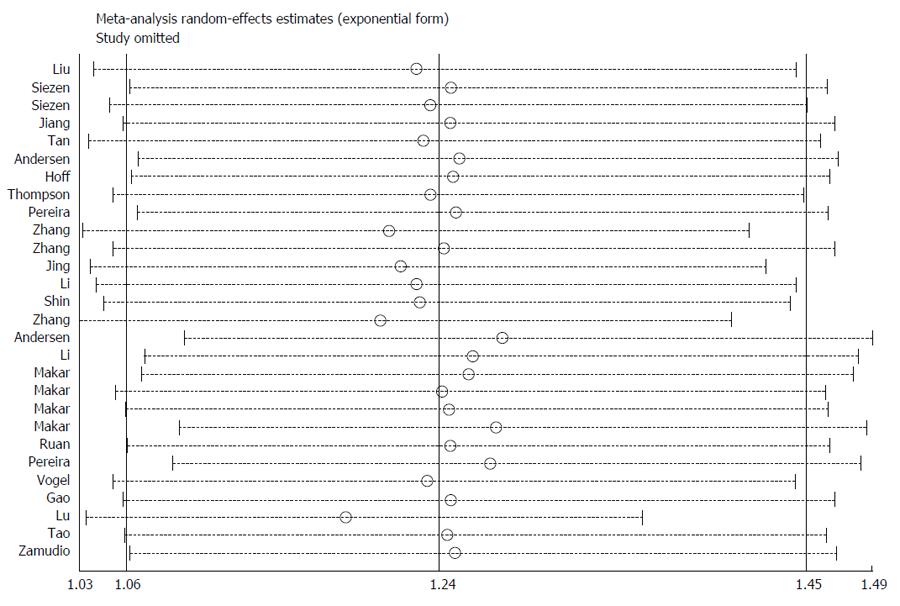
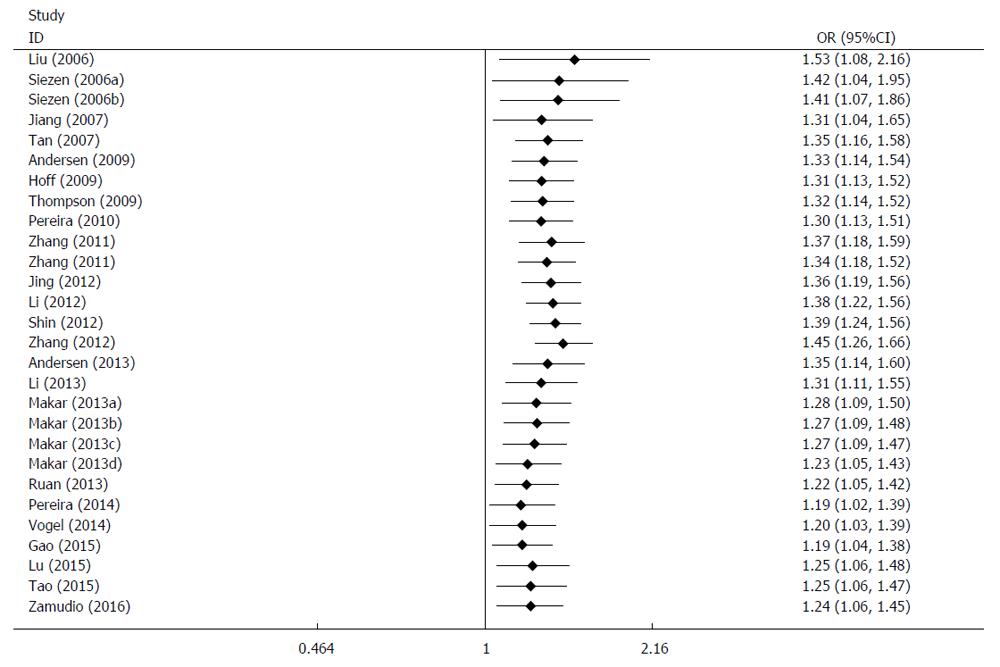
Figure 4 Analysis of the influence of a single study on the total combined OR in the dominant model (AA/AG vs GG).
Figure 5 Cumulative meta-analysis of the COX-2 -1195G>A polymorphism and gastrointestinal cancer susceptibility in the dominant model (AA/AG vs GG).
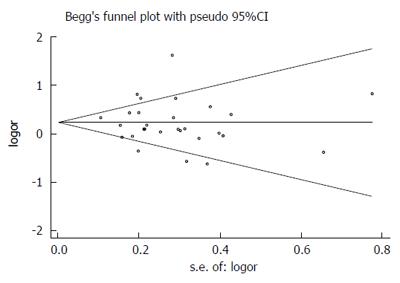
Figure 6 Begg’s funnel plot of the publication bias in the COX-2 -1195G>A dominant model (AA/AG vs GG).
- Citation: Zhang XW, Li J, Jiang YX, Chen YX. Association between COX-2 -1195G>A polymorphism and gastrointestinal cancer risk: A meta-analysis. World J Gastroenterol 2017; 23(12): 2234-2245
- URL: https://www.wjgnet.com/1007-9327/full/v23/i12/2234.htm
- DOI: https://dx.doi.org/10.3748/wjg.v23.i12.2234


