Copyright
©The Author(s) 2017.
World J Gastroenterol. Mar 14, 2017; 23(10): 1804-1815
Published online Mar 14, 2017. doi: 10.3748/wjg.v23.i10.1804
Published online Mar 14, 2017. doi: 10.3748/wjg.v23.i10.1804
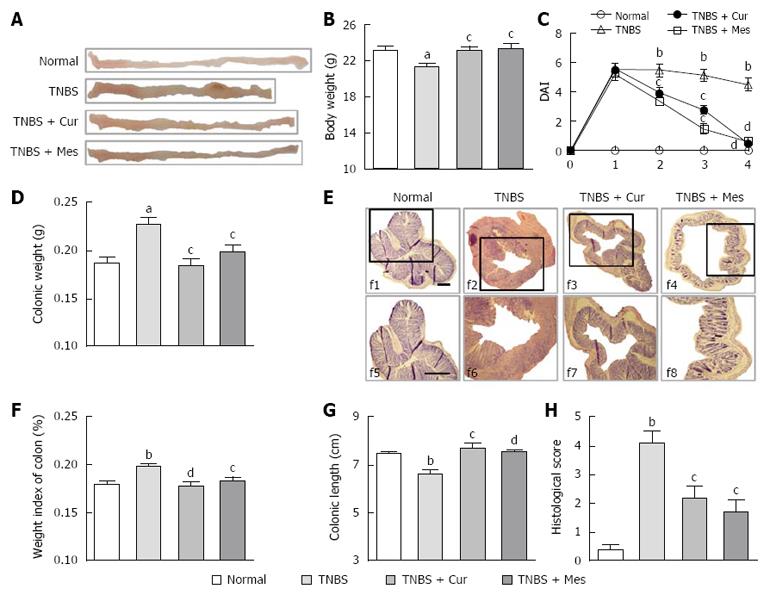
Figure 1 Macroscopic and microscopic observation.
A: Macrography of the opened colon; B: Body weight; C: DAI score; D: Colonic weight; E: Weight index of the colon; F: Typical histological images stained by hematoxylin and eosin, f1-4: Bar = 40 μm, f5-8: Bar = 100 μm; G: Colonic length; H: Histological scores. Data are presented as mean ± SEM (n = 8). aP < 0.05 and bP < 0.01 vs Normal group; cP < 0.05 and dP < 0.01 vs TNBS group.
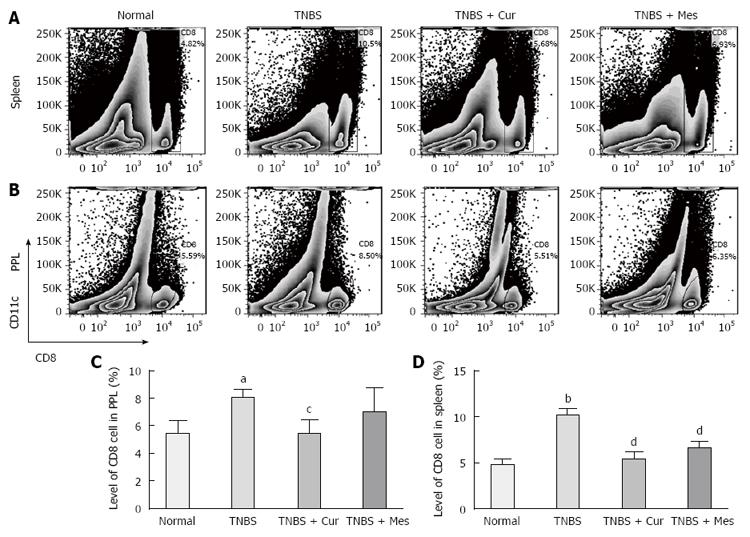
Figure 2 Typical histograms and levels of CD8+CD11c+ cells in the spleen and PPs.
A: Typical graphs and mean fluorescence intensity (MFI) levels of CD8+CD11c+ cells in the spleen; B: Typical graphs and MFI levels of CD8+CD11c+ cells in PPs; C: MFI levels of CD8+CD11c+ cells in the spleen; D: MFI levels of CD8+CD11c+ cells in PPs. Data are shown as mean ± SEM (n = 8). aP < 0.05 and bP < 0.01 vs Normal group; cP < 0.05 and dP < 0.01 vs TNBS group.
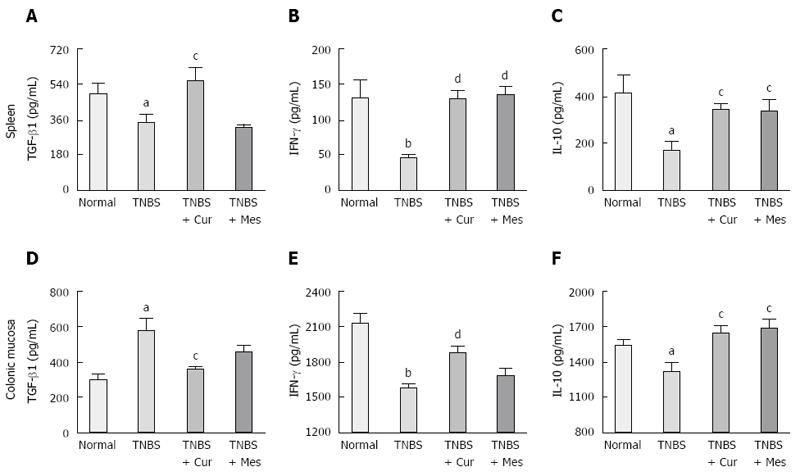
Figure 3 Levels of TGF-β1, IFN-γ and IL-10 in spleen and colonic mucosal supernatants.
A-C: Concentration of TGF-β1, IFN-γ and IL-10 in the spleen from different groups; D-F: Concentration of TGF-β1, IFN-γ and IL-10 in the colonic mucosa from different groups. Data are shown as mean ± SEM (n = 8). aP < 0.05 and bP < 0.01 vs Normal group; cP < 0.05 and dP < 0.01 vs TNBS group.
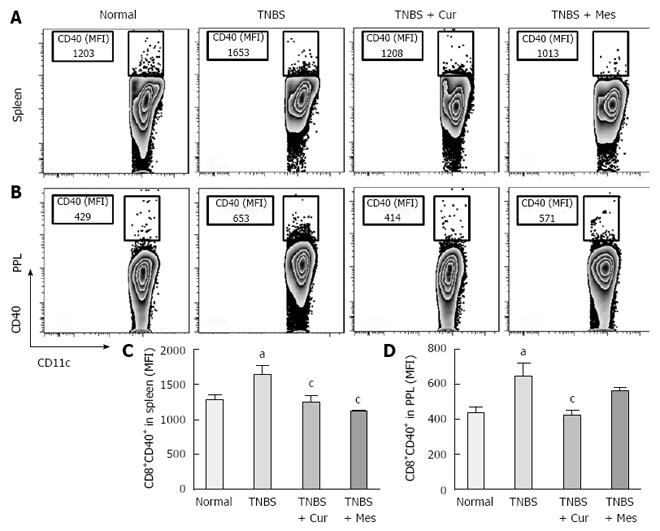
Figure 4 Typical histograms and levels of CD11c+CD40+ cells in spleen and PPs.
A: Typical graphs of CD11c+CD40+ cells in the spleen; B: Typical graphs of CD11c+CD40+ cells in the PPs; C: MFI levels of CD11c+CD40+ cells in the spleen; D: MFI levels of CD11c+CD40+ cells in the PPs. Data are described as mean ± SEM (n = 8). aP < 0.05 vs Normal control group; cP < 0.05 vs TNBS group.
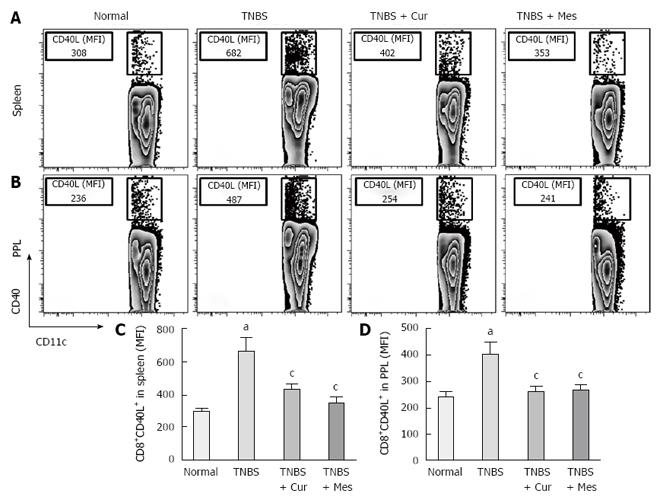
Figure 5 Typical histograms and levels of CD11c+CD40L+ cell in spleen and PPs.
A: Typical graphs of CD11c+CD40L+ cells in the spleen; B: Typical graphs of CD11c+ CD40L+ cells in PPs; C: Levels (MFI) of CD11c+CD40L+ cells in the spleen; D: Levels (MFI) of CD11c+CD40L+ cells in PPs. Data are described as mean ± SEM (n = 8). aP < 0.05 vs Normal control group; cP < 0.05 vs TNBS group.
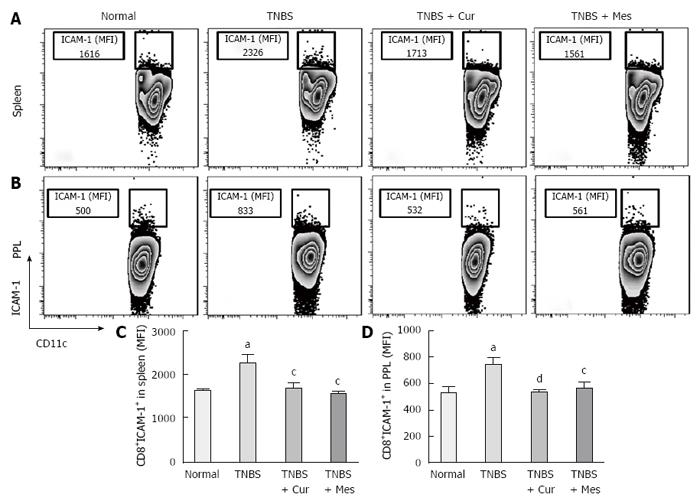
Figure 6 Typical histograms and levels of CD11c+ ICAM-1+ cells in spleen and PPs.
A: Typical graphs of CD11c+ICAM-1+ cells in the spleen; B: Typical graphs of CD11c+ICAM-1+ cells in PPs; C: Levels (MFI) of CD11c+ ICAM-1+ cells in the spleen; D: Levels (MFI) of CD11c+ICAM-1+ cells in the PPs. Data are shown as mean ± SEM (n = 8). aP < 0.05 vs Normal control group; cP < 0.05 and dP < 0.01 vs TNBS group.
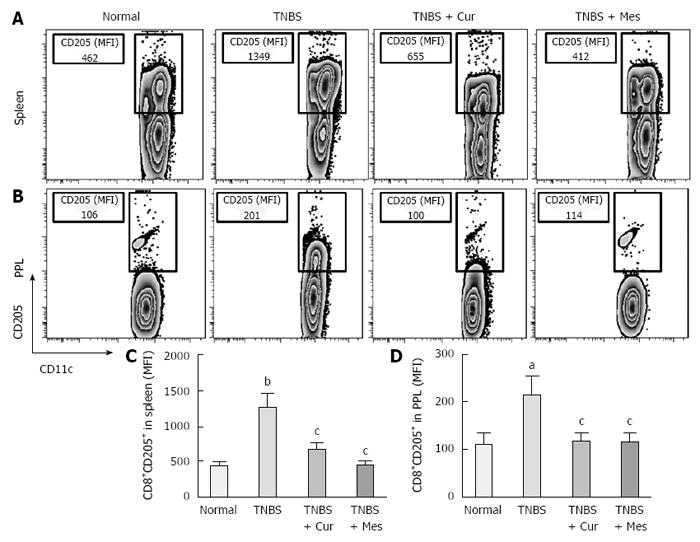
Figure 7 Typical histograms and levels of CD11c+CD205+ cells in the spleen and PPs.
A: Typical graphs of CD11c+ CD205 + cells in the spleen; B: Typical graphs of CD11c+CD205+ cells in the PPs; C: Levels (MFI) of CD11c+CD205+ cells in the spleen; D: Levels (MFI) of CD11c+CD205+ cells in PPs. Data are mean ± SEM (n = 8). aP < 0.05 and bP < 0.01 vs Normal group; cP < 0.05 vs TNBS group.
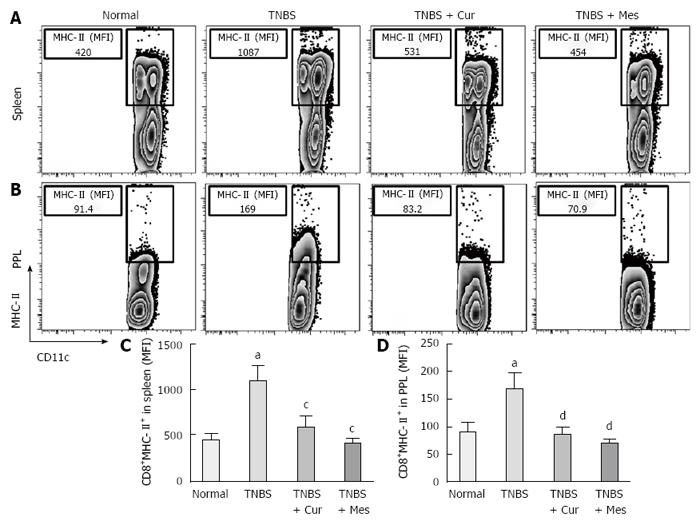
Figure 8 Typical histograms and levels of CD11c+MHC II+ cells in the spleen and PPs.
A: Typical graphs of CD11c+ MHC II+ cells in the spleen; B: Typical graphs of CD11c+ MHC II+ cells in the PPs; C: Levels (MFI) of CD11c+ MHC II+ cells in the spleen; D: Levels (MFI) of CD11c+ MHC II+ cells in the PPs. Data are mean ± SEM (n = 8). aP < 0.05 vs Normal control group; cP < 0.05 and dP < 0.01 vs TNBS group.
- Citation: Zhao HM, Han F, Xu R, Huang XY, Cheng SM, Huang MF, Yue HY, Wang X, Zou Y, Xu HL, Liu DY. Therapeutic effect of curcumin on experimental colitis mediated by inhibiting CD8+CD11c+ cells. World J Gastroenterol 2017; 23(10): 1804-1815
- URL: https://www.wjgnet.com/1007-9327/full/v23/i10/1804.htm
- DOI: https://dx.doi.org/10.3748/wjg.v23.i10.1804


