Copyright
©The Author(s) 2017.
World J Gastroenterol. Mar 14, 2017; 23(10): 1796-1803
Published online Mar 14, 2017. doi: 10.3748/wjg.v23.i10.1796
Published online Mar 14, 2017. doi: 10.3748/wjg.v23.i10.1796
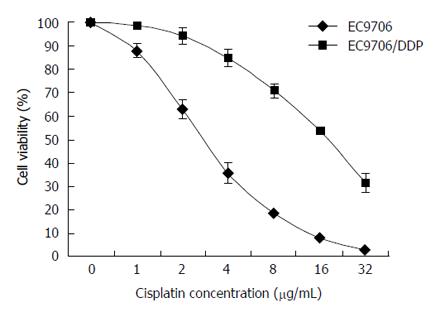
Figure 1 Survival rate of EC9706 and EC9706/cisplatin (DDP) cells treated with various concentrations of DDP.
A dose-dependent association between the survival rate of EC9706 and EC9706/DDP cells and the concentration of DDP can be observed. The survival of EC9706 cells was significantly lower compared to EC9706/DDP cells following treatment with various concentrations of DDP. The IC50 of DDP in EC9706 cells is 3.34 ± 0.27 μg/mL, while the IC50 of DDP in EC9706/DDP cells is 16.83 ±1.46 μg/mL.
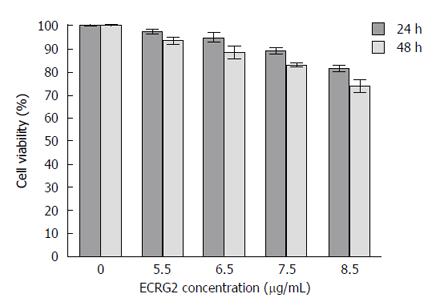
Figure 2 Survival rate at various concentrations of esophageal cancer-related gene 2.
A dose- and time- dependent association between the survival rate of the EC9706/cisplatin (DDP) cells and the concentration of ECRG2. A longer incubation time with ECRG2 significantly decreased the survival rate of EC9706/DDP cells. The same was found for treatments with a higher concentration of ECRG2.
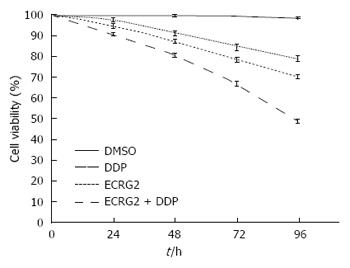
Figure 3 Effects of esophageal cancer-related gene 2 combined with cisplatin (DDP) on cell viability in EC9706/DDP cells.
Cells were treated with dimethyl sulfoxide, ECRG2 (6.5 μg/mL) alone, DDP (3 μg/mL) alone, or a combination of ECRG2 (6.5 μg/mL) and DDP (3 μg/mL) for 24 h, 48 h, 72 h, and 96 h. Cell viability was detected via MTT assay.
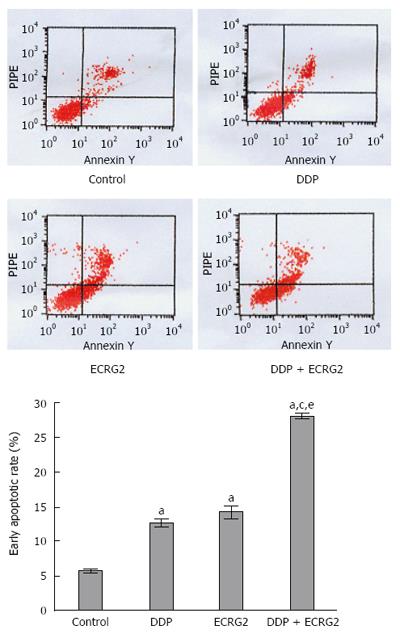
Figure 4 Effects of esophageal cancer-related gene 2 combined with cisplatin (DDP) on cell apoptosis in EC9706/DDP cells.
Cells were treated with esophageal cancer-related gene 2 (ECRG2) (6.5 μg/mL) alone, DDP (3 μg/mL) alone, or a combination of ECRG2 and DDP for 24 h. Early apoptosis was determined by flow cytometry using annexin V/PI staining. Annexin V was set as the horizontal axis and PI was set as the vertical axis. Mechanically-damaged cells are located in the upper left quadrant, apoptotic or necrotic cells in the upper right quadrant, dual negative and normal cells in the lower left quadrant, and early apoptotic cells in the lower right quadrant of the flow cytometry dot plot. Data are shown as the mean ± SD. aP < 0.05 vs control group; cP < 0.05 ECRG2 +DDP vs DDP; eP < 0.05 ECRG2 + DDP vs ECRG2.
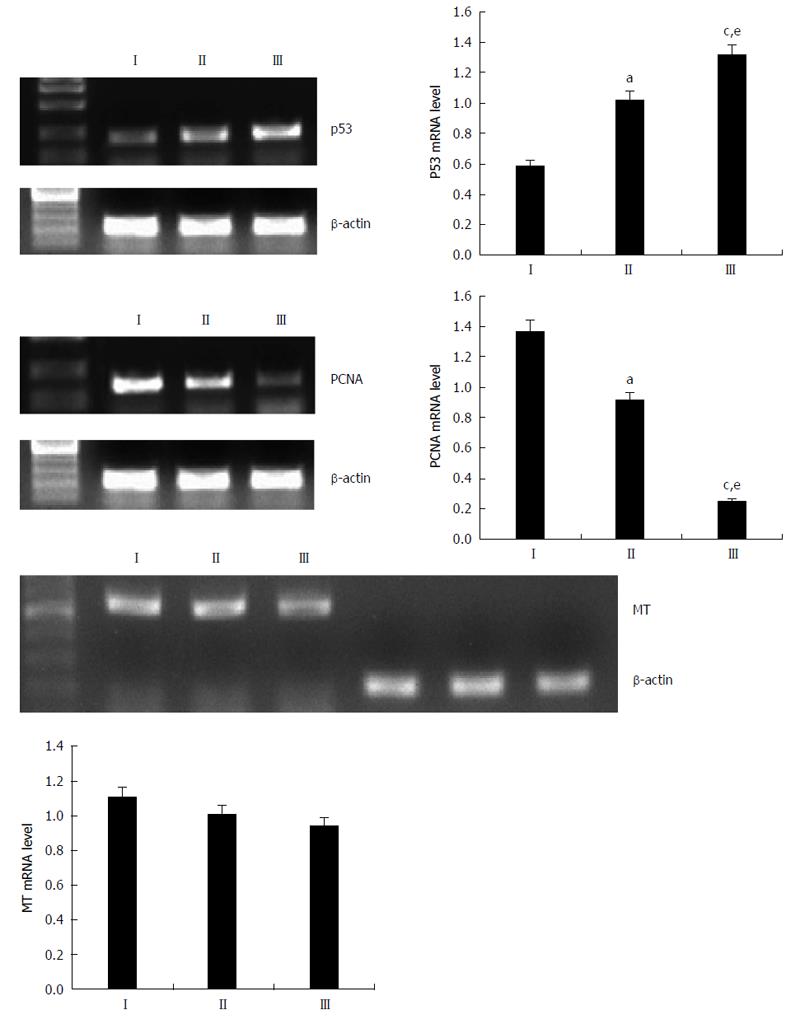
Figure 5 Effects of esophageal cancer-related gene 2 and cisplatin (DDP) on the expression of proliferating cell nuclear antigen, p53, and metallothionein mRNA.
I: Drug-resistant cell group; II: DDP group; III: DDP + esophageal cancer-related gene 2 (ECRG2) group. Data were expressed as the mean ± SD, n = 3. aP < 0.05 vs control; cP < 0.05 vs control; eP < 0.05 vs DDP groups.
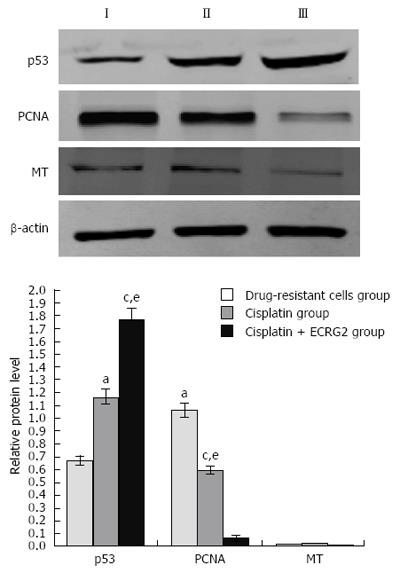
Figure 6 Effects of esophageal cancer-related gene 2 and cisplatin (DDP) on the expression of proliferating cell nuclear antigen, p53, and metallothionein proteins.
I: Drug-resistant cell group; II: DDP group; III: DDP + esophageal cancer-related gene 2 (ECRG2) group. Data were expressed as the mean ± SD, n = 3. aP < 0. 05 vs control; cP < 0.05 vs control; eP < 0.05 vs DDP groups.
- Citation: Hou XF, Xu LP, Song HY, Li S, Wu C, Wang JF. ECRG2 enhances the anti-cancer effects of cisplatin in cisplatin-resistant esophageal cancer cells via upregulation of p53 and downregulation of PCNA. World J Gastroenterol 2017; 23(10): 1796-1803
- URL: https://www.wjgnet.com/1007-9327/full/v23/i10/1796.htm
- DOI: https://dx.doi.org/10.3748/wjg.v23.i10.1796


