Copyright
©The Author(s) 2017.
World J Gastroenterol. Mar 14, 2017; 23(10): 1771-1779
Published online Mar 14, 2017. doi: 10.3748/wjg.v23.i10.1771
Published online Mar 14, 2017. doi: 10.3748/wjg.v23.i10.1771
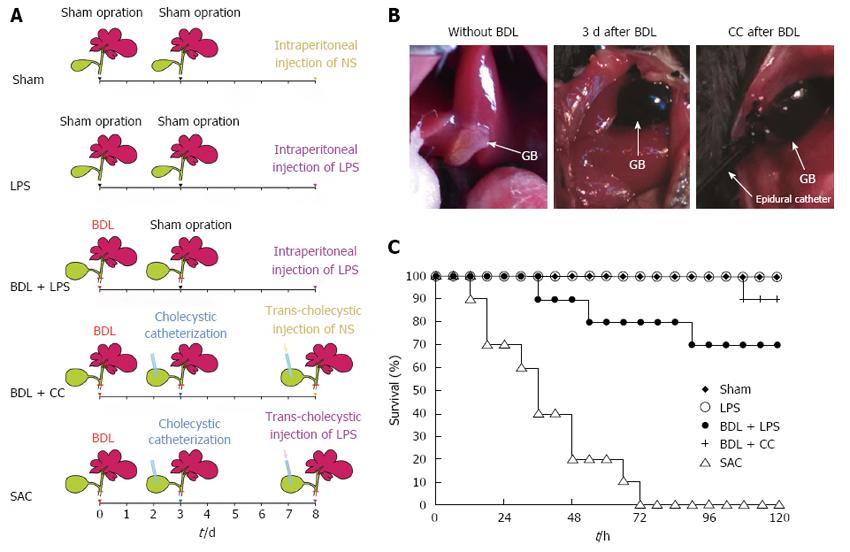
Figure 1 Cholecystostomy.
A: Schematic description of experimental groups; B: Cholecystic catheterization under the condition of bile duct ligation; C: The survival rates of mice in five groups after intraperitoneal injection or trans-cholecystic injection (n = 10). BDL: Bile duct ligation; CC: Cholecystic catheterization; NS: Normal saline.
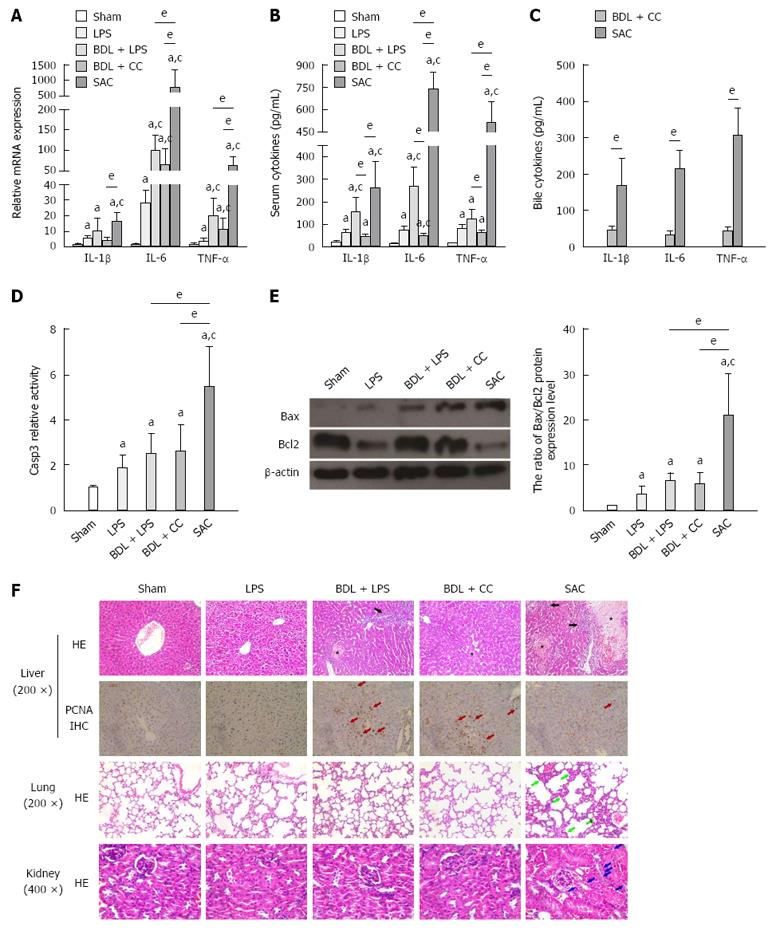
Figure 2 Liver injury is significantly facilitated in severe acute cholangitis mouse model.
A: Relative expression levels of IL-1β, IL-6 and TNF-α in liver tissues were examined by real-time PCR at 24 h after the last operation (n = 6); B and C: Determination of pro-inflammatory cytokines in serum and bile of mice by ELISA at 48 h after the last operation (n = 6); D and E: The activity of Caspase 3 and the ratio of Bax to Bcl2 protein expression level were examined in different groups (n = 6); F: Histological examination of liver tissues (HE staining × 200, PCNA-IHC staining × 200), lung tissues (HE staining × 200) and kidney tissues (HE staining × 400) in different groups. Asterisk: necrosis. Black arrow: Inflammatory cell infiltration in liver tissue. Red arrow: PCNA-positive hepatocytes. Green arrow: abundant inflammatory cell infiltration in lung tissue. Blue arrow: The cells with vacuolization in kidney. aP < 0.05 vs sham group; cP < 0.05 vs LPS group; eP < 0.05, difference between the two groups.
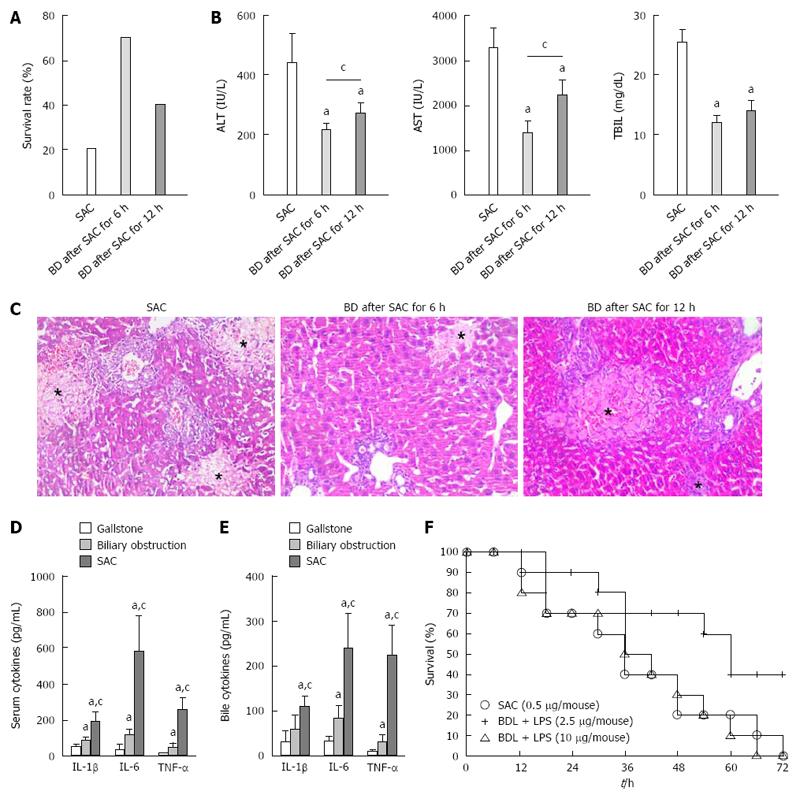
Figure 3 Relieving biliary obstruction reduces mortality and attenuates liver injury in the severe acute cholangitis mouse model.
A: The survival rates of SAC mice with or without biliary drainage were determined at 48 h after model establishment (n = 10); B: ALT, AST, and TBIL of SAC mice with or without biliary drainage were examined at 48 h after model establishment (n = 6). aP < 0.05 vs SAC group; cP < 0.05, difference between the two groups; C: Histological analysis of liver tissues in mice after different treatments (HE × 200), asterisk: necrosis; D and E: Determination of pro-inflammatory cytokines in serum and bile of patients with or without SAC (n = 6). aP < 0.05 vs gallstone group; cP < 0.05 vs biliary obstruction group; F: The survival rates of mice which were intraperitoneally injected with high-dose of LPS under the condition of biliary obstruction. BD: Biliary drainage.
- Citation: Yu JH, Tang HJ, Zhang WG, Zhu ZY, Ruan XX, Lu BC. Catheterization of the gallbladder: A novel mouse model of severe acute cholangitis. World J Gastroenterol 2017; 23(10): 1771-1779
- URL: https://www.wjgnet.com/1007-9327/full/v23/i10/1771.htm
- DOI: https://dx.doi.org/10.3748/wjg.v23.i10.1771


