Copyright
©The Author(s) 2017.
World J Gastroenterol. Mar 14, 2017; 23(10): 1764-1770
Published online Mar 14, 2017. doi: 10.3748/wjg.v23.i10.1764
Published online Mar 14, 2017. doi: 10.3748/wjg.v23.i10.1764
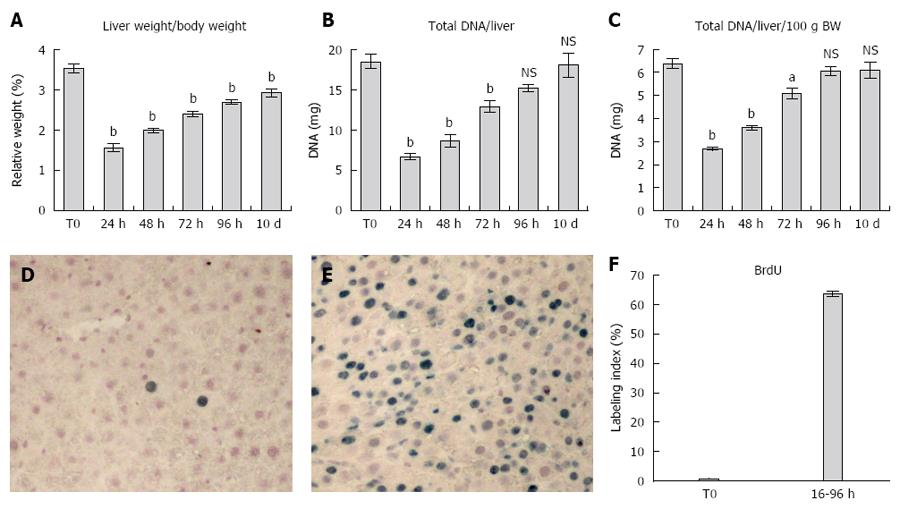
Figure 1 Kinetics of liver mass restoration following partial surgical hepatectomy.
A: Showing the gradual increase in relative liver weight, which has almost returned to control values at 10 d post-surgery, albeit a small significant difference is still present; B and C: Reporting data on liver DNA content: both total liver DNA and the relative amount (expressed as % body weight) had largely recovered at 96 h post-PH and were back to normal values by 10 d after operation; D-F: Cumulative S-phase entry of hepatocytes in response to PH. Immunohistochemical staining for BrdU is shown in panels D (control rat liver) and E (cumulative labelling from 16 to 96 h post-PH). The histogram in panel F reports percent of hepatocytes that had incorporated BrdU in their nuclei between 16 and 96 h post PH (see Methods for details). Data are mean ± SE of 5 animals per group. aP < 0.05, bP < 0.01 vs control group. PH: Partial surgical hepatectomy.
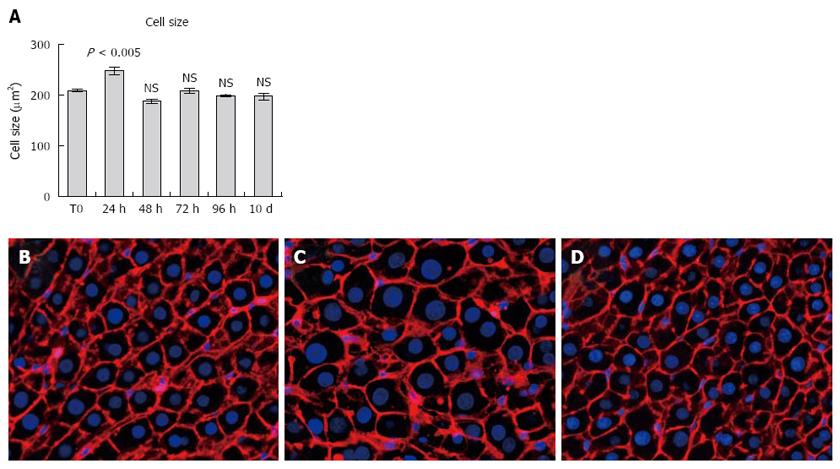
Figure 2 Hepatocyte size during the regenerative response to partial surgical hepatectomy.
A: Reporting mean area of hepatocytes in control rat liver and at various time points after PH. At least five hundred hepatocytes per animal in each group were scored. Data are mean ± SE of 5 animals per group. Immunofluorescent staining for Phalloidin is shown in panels B (control rat liver), C (24 h post-PH) and D (10 d post-PH). Nuclei were counterstained with DAPI. PH: Partial surgical hepatectomy.
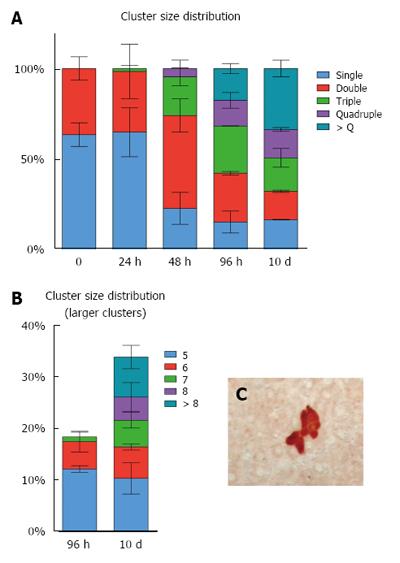
Figure 3 Size distribution of GFP+ hepatocyte clusters at various time points after partial surgical hepatectomy.
A: Each cluster was 3D reconstructed (see Methods for details) and number of hepatocytes was counted. Bars of the histogram report the frequency of each class size expressed as percent of the total number of clusters. At least one hundred clusters per group were computed; B: An expansion of panel A. It shows the class size distribution of largest clusters present at 96 h and 10 d after PH; C: An image of immunohistochemical staining for GFP. PH: Partial surgical hepatectomy; GFP+: Green fluorescent protein.
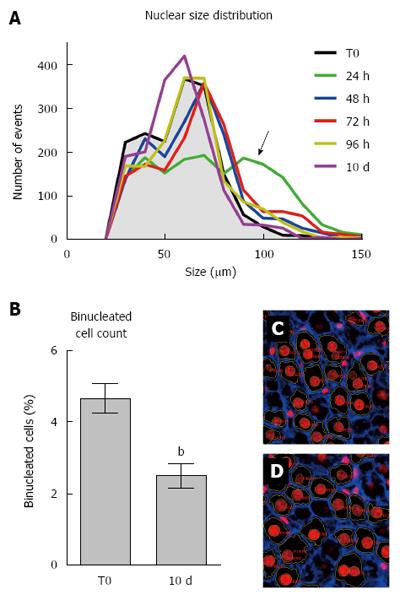
Figure 4 Size distribution of hepatocyte nuclei, the only evident change being detected after 24 h.
A: Showing nuclear size distribution over time following PH. The most prominent change is observed at 24 h post-PH (green line), with the appearance of a larger nuclear class size (arrow), which is only marginally present at later time points; B: Reporting percent of binucleated hepatocytes detected on 2D sections in control rat liver and at 10 d post-PH. A relative decrease is observed after PH; C (control rat liver) and D (10 d post-PH) show immunofluorescent staining for Phalloidin with nuclei were counterstained with DAPI. Binucleated hepatocytes are easily discerned. Data are mean ± SE of 5 animals per group. bP < 0.01, vs control group. PH: Partial surgical hepatectomy.
- Citation: Marongiu F, Marongiu M, Contini A, Serra M, Cadoni E, Murgia R, Laconi E. Hyperplasia vs hypertrophy in tissue regeneration after extensive liver resection. World J Gastroenterol 2017; 23(10): 1764-1770
- URL: https://www.wjgnet.com/1007-9327/full/v23/i10/1764.htm
- DOI: https://dx.doi.org/10.3748/wjg.v23.i10.1764


