Copyright
©The Author(s) 2016.
World J Gastroenterol. Feb 28, 2016; 22(8): 2566-2575
Published online Feb 28, 2016. doi: 10.3748/wjg.v22.i8.2566
Published online Feb 28, 2016. doi: 10.3748/wjg.v22.i8.2566
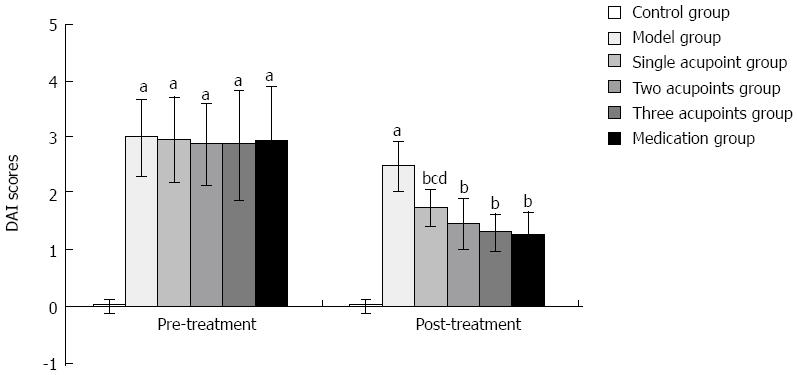
Figure 1 Comparison of DAI scores.
DAI decreased significantly after the different treatments. Data are expressed as mean ± SD; n = 8/group. aP < 0.01 vs control group; bP < 0.01 vs model group; cP < 0.05 vs three acupoints group; dP < 0.05 vs medication group. DAI: Disease activity index.
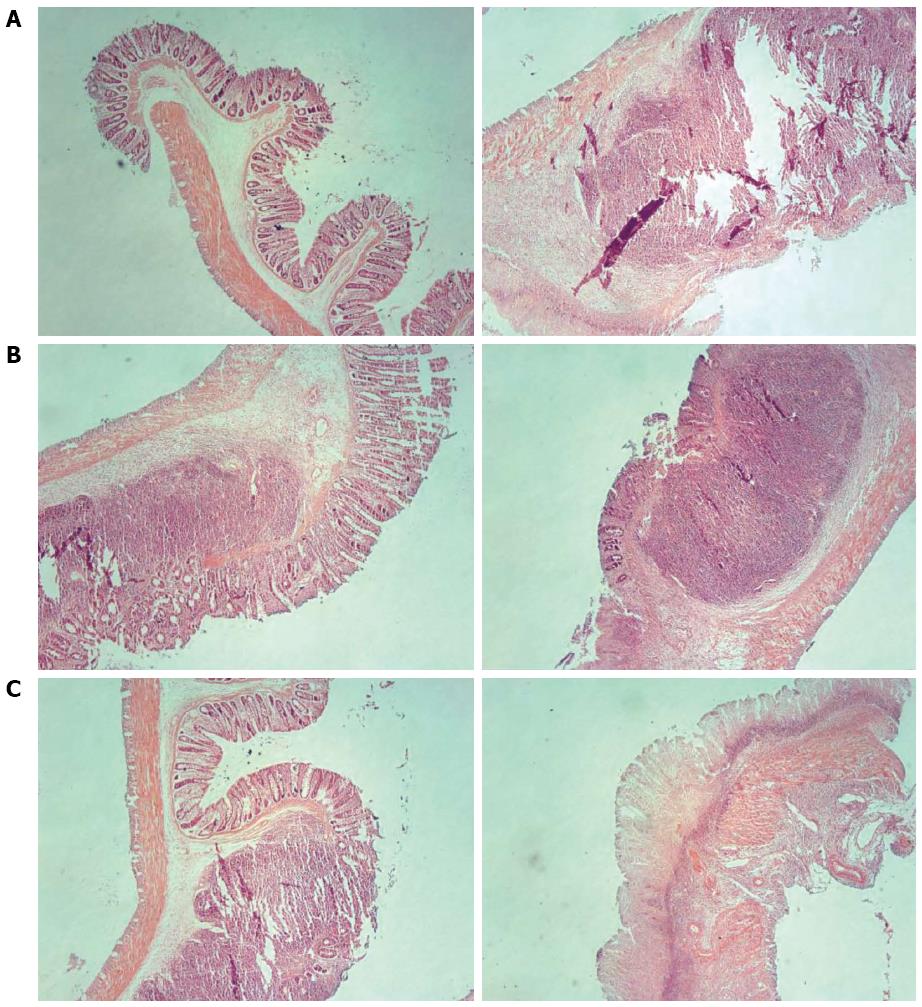
Figure 2 Morphologic changes in colonic tissue of rats.
A: Control group (left) and model group (right); B: Single acupoint group (left) and two acupoints group (right); C: Three acupoints group (left) and medication group (right). There was mucosal and tissue injury in the model group. The recovery in the three acupoints and medication groups was slightly superior to that in the single and two acupoints groups (hematoxylin-eosin staining, × 50 magnification).
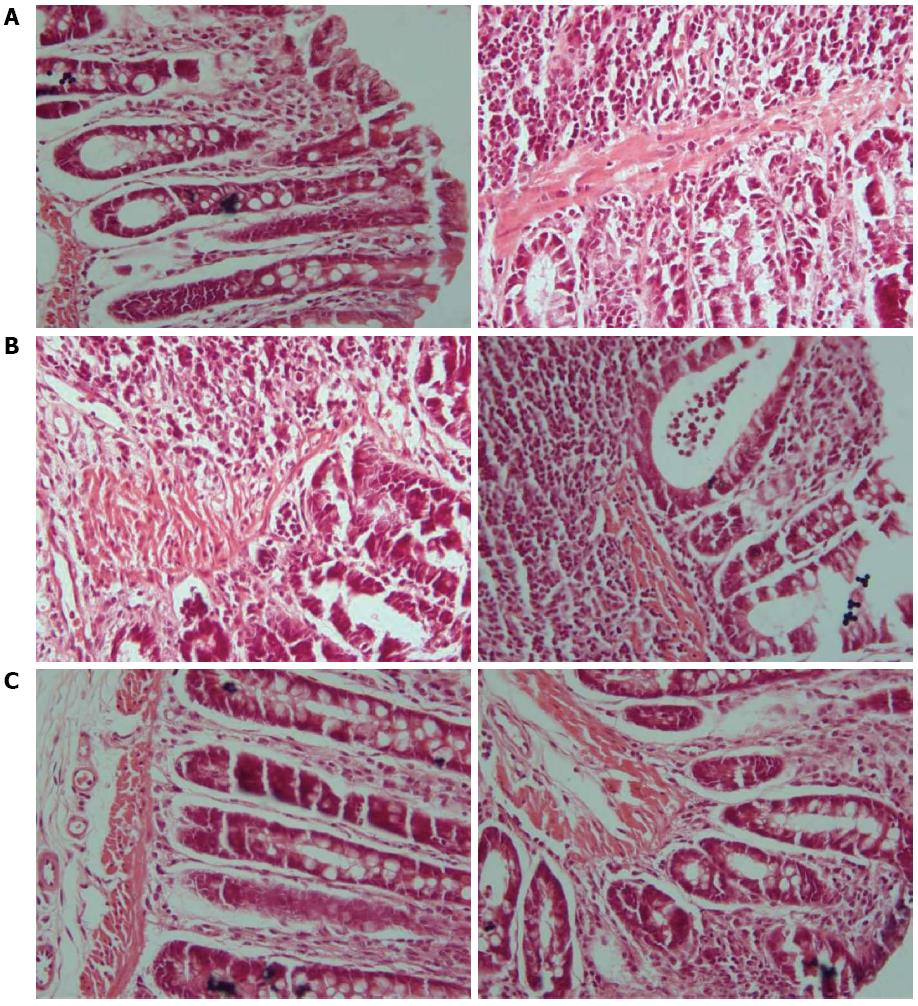
Figure 3 Higher detail of morphologic changes in colonic tissue of rats.
A: Control group (left) and model group (right); B: Single acupoint group (left) and two acupoints group (right); C: Three acupoints group (left) and medication group (right). In the model group, intestinal mucosa was deficient, the arrangement of gland was irregular and submucosa was edematous, hyperemic and infiltrated with inflammatory cells. After the different treatments, the gland, mucosa, etc. were improved significantly. The efficacy in the three acupoints and medication groups was superior to that of the single and two acupoints groups (hematoxylin-eosin staining, × 400 magnification).
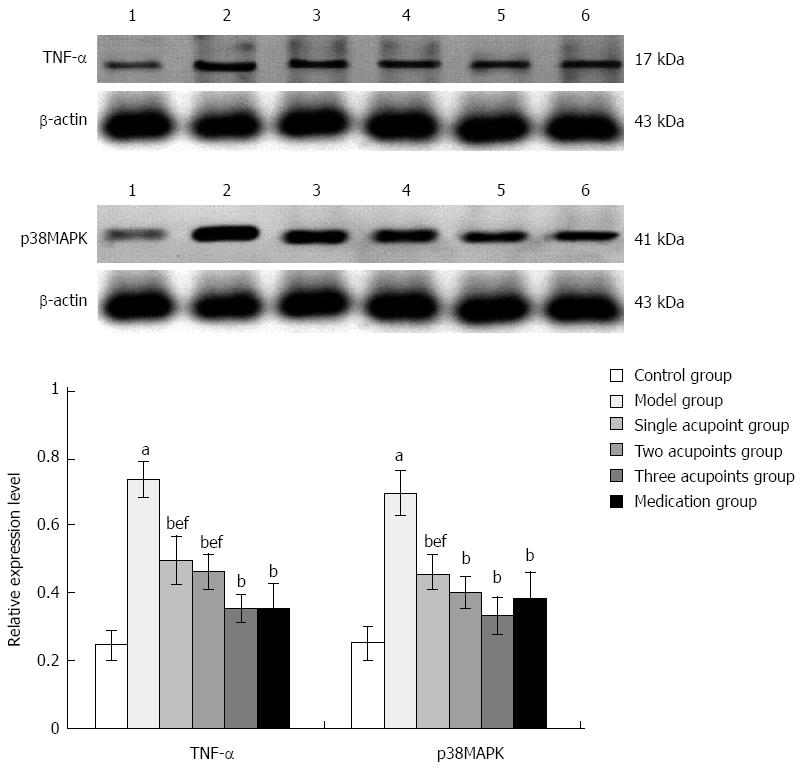
Figure 4 Comparison of tumor necrosis factor-α and p38 mitogen-activated protein kinase expression in colonic tissue.
Representative Western blot and quantification showing that the expression of TNF-α and p38MAPK protein are decreased significantly after the different treatments. Data are expressed as mean ± SD; n =6/group. aP < 0.01 vs control group; bP < 0.01 vs model group; eP < 0.01 vs three acupoints group; fP < 0.01 vs medication group. Lane 1: control group, 2: model group, 3: single acupoint group, 4: two acupoints group, 5: three acupoints group, 6: medication group. TNF-α: Tumor necrosis factor-α; p38MAPK: p38 mitogen-activated protein kinase.
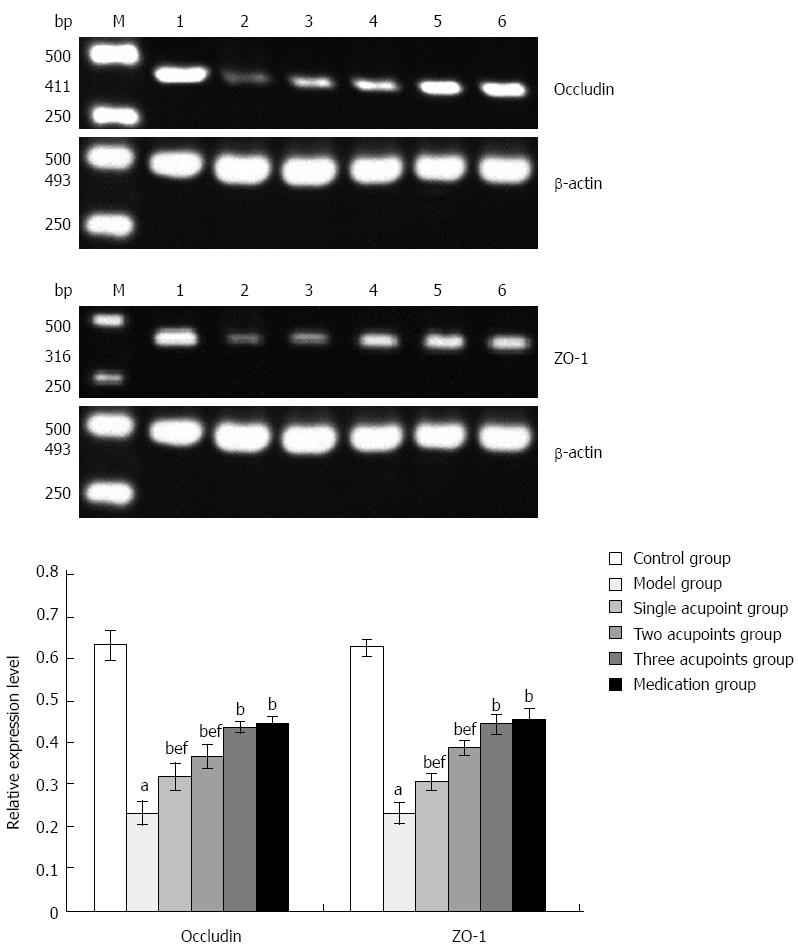
Figure 5 Comparison of occludin and zonula occludens-1 mRNA levels in colonic tissue.
The levels of occludin and ZO-1 mRNAs increased significantly after the different treatments. The efficacy of the three acupoints and medication groups was superior to that of the single and two acupoints groups. Data are expressed as mean ± SD; n = 6/group. aP < 0.01 vs control group; bP < 0.01 vs model group; eP < 0.01 vs three acupoints group; fP < 0.01 vs medication group. Lane M: marker, 1: control group, 2: model group, 3: single acupoint group, 4: two acupoints group, 5: three acupoints group, 6: medication group. ZO-1: Zonula occludens-1.
- Citation: Ma TM, Xu N, Ma XD, Bai ZH, Tao X, Yan HC. Moxibustion regulates inflammatory mediators and colonic mucosal barrier in ulcerative colitis rats. World J Gastroenterol 2016; 22(8): 2566-2575
- URL: https://www.wjgnet.com/1007-9327/full/v22/i8/2566.htm
- DOI: https://dx.doi.org/10.3748/wjg.v22.i8.2566


