Copyright
©The Author(s) 2016.
World J Gastroenterol. Feb 28, 2016; 22(8): 2545-2557
Published online Feb 28, 2016. doi: 10.3748/wjg.v22.i8.2545
Published online Feb 28, 2016. doi: 10.3748/wjg.v22.i8.2545
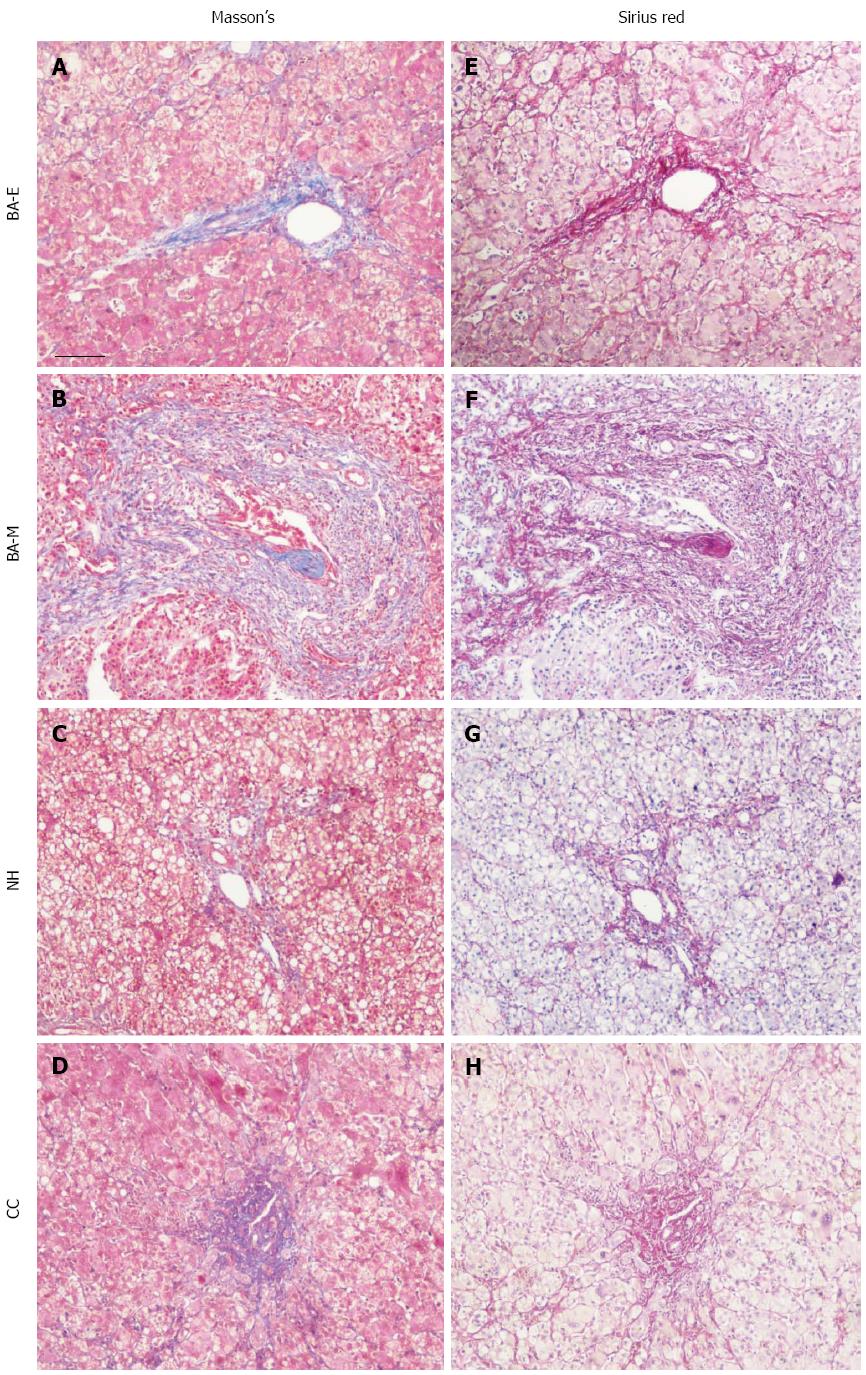
Figure 1 Evaluation of tissue fibrosis in biliary atresia, choledochal cyst, and neonatal hepatitis patients.
Liver tissues from patients with BA, CC, and NH were collected and adjacent sections were cut. Tissue fibrosis was evaluated with Masson’s Trichrome Stain, in which the collagen was detected by blue color. Depending on the stage of fibrosis, sections from patients with BA were further separated into two groups: early stage BA (BA-E), with no or mild collagen deposition, and middle or late stage BA (BA-ML), with dense collagen deposition. The adjacent tissue sections were further stained with Sirius Red to validate the results, with collagen detected by pink color. Sections were examined with a Nikon light microscope. Scale bar shown represents 50 μm. NH: Neonatal hepatitis; CC: Choledochal cyst; BA: Biliary atresia.
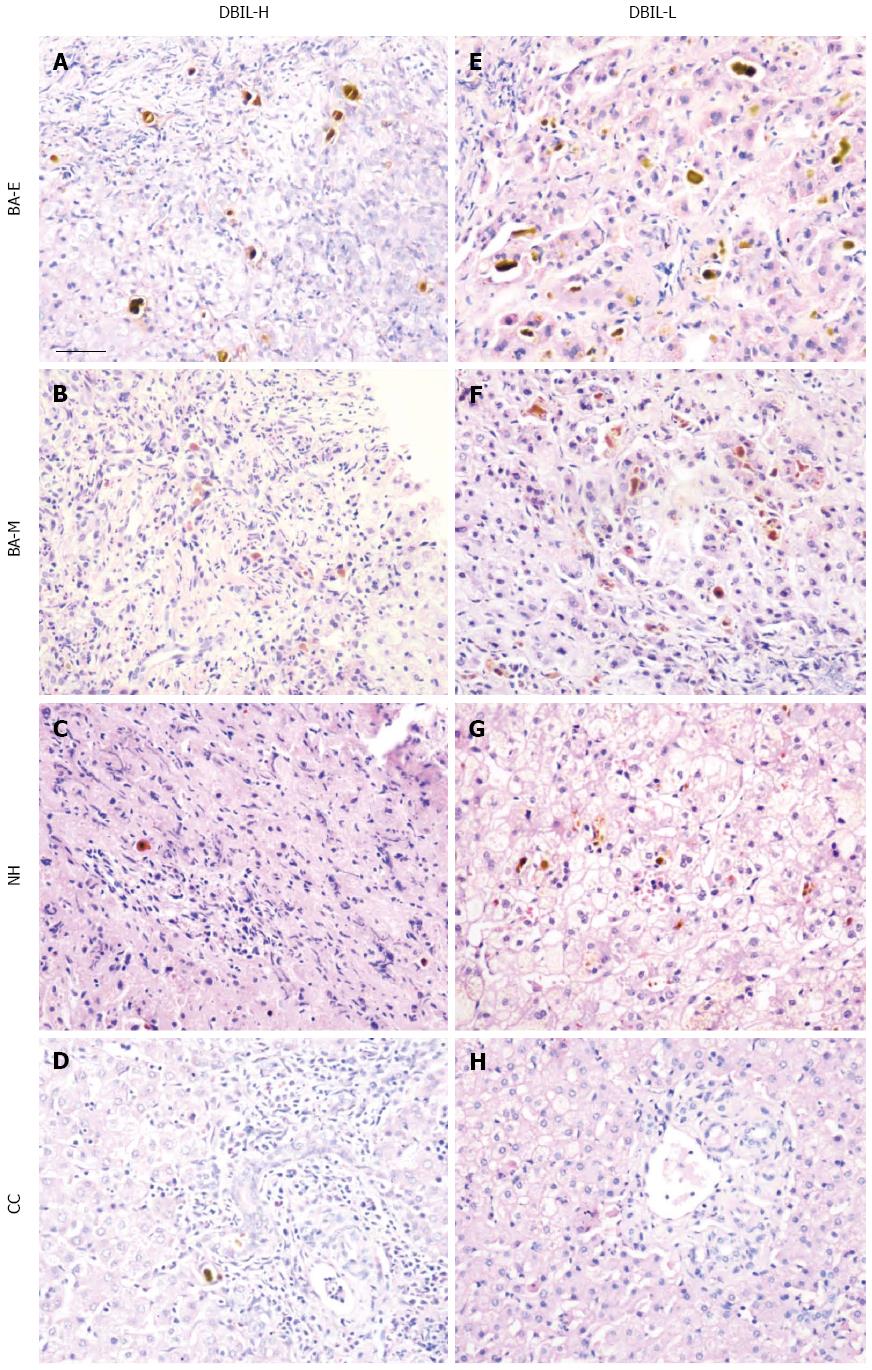
Figure 2 Comparison of bile plugs in biliary atresia, choledochal cyst, and neonatal hepatitis patients.
HE staining was performed on tissue sections from patients with three cholestatic diseases: biliary atresia [early (BA-E) and middle and late (BA-ML)], CC, and NH. The sections were separated based on their serum levels of DBIL into two groups: bilirubin high (DBIL-H) and bilirubin low (DBIL-L), with the sections containing the highest number of bile plugs in each group selected and photographed. The sections were examined with a Nikon light microscope. Scale bar represents 50 μm. CC: Choledochal cyst; DBIL: Direct bilirubin; HE: Hematoxylin and eosin; NH: Neonatal hepatitis
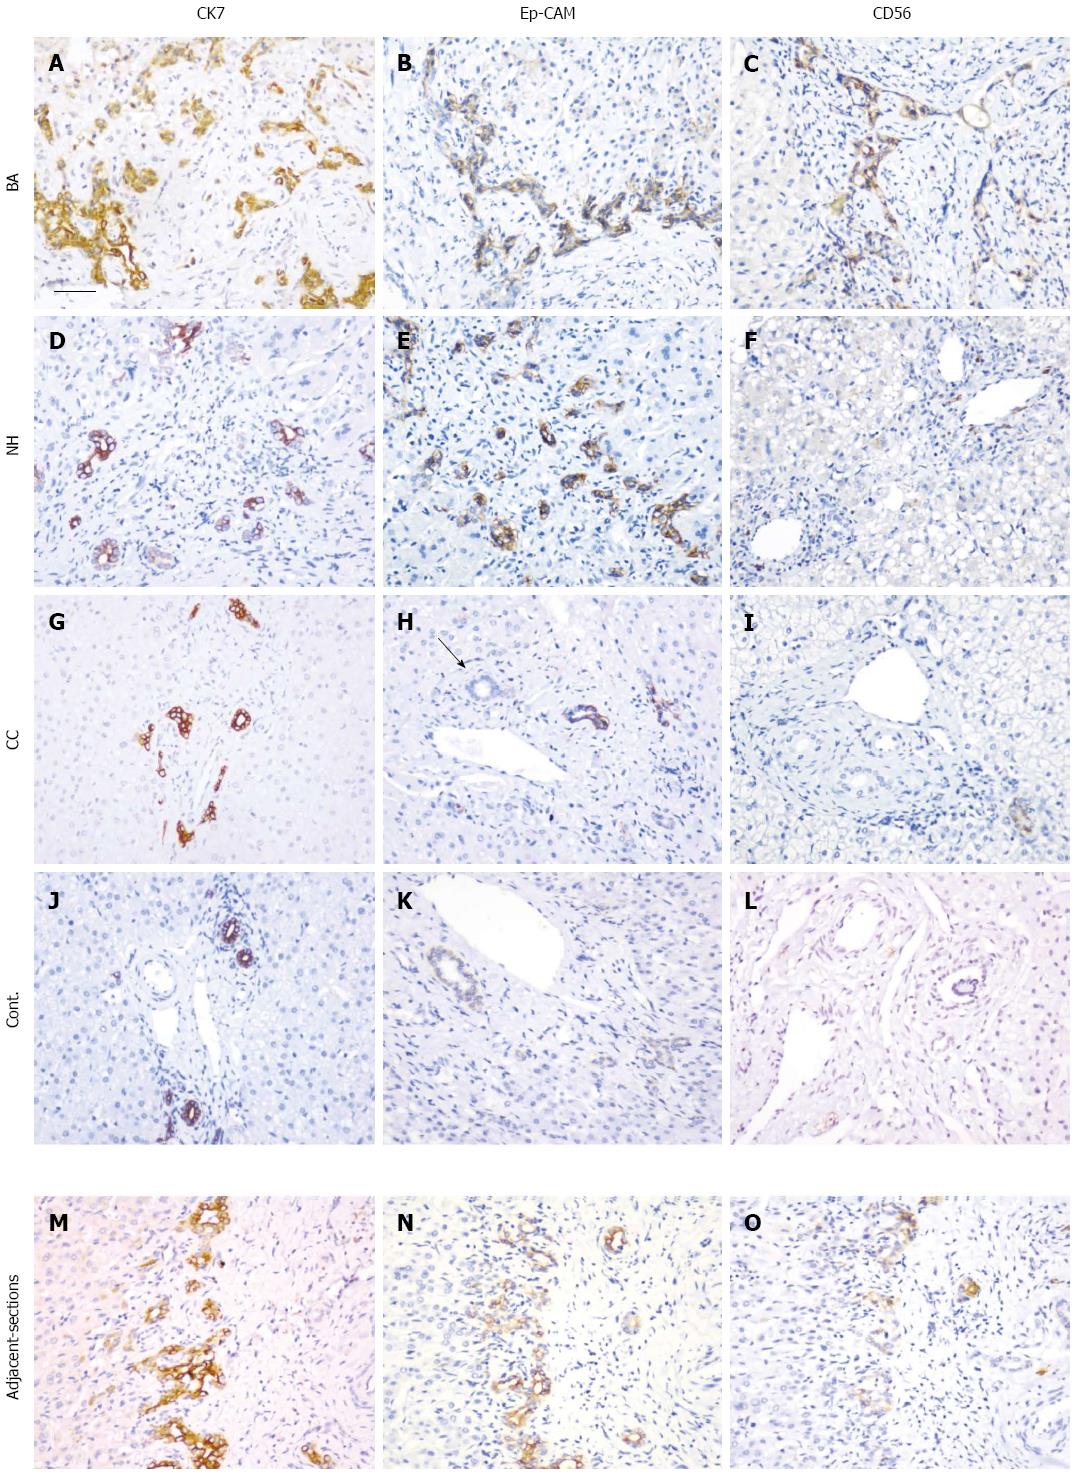
Figure 3 Immunohistochemical analysis of the expression of cytokeratin 7, epithelial cell adhesion molecule, and CD56.
Tissue sections from patients with BA (A-C), NH (D-F), CC (G-I), and the disease control (J-L) together with a set of adjacent sections (M-O) were selected. Immunohistochemical staining was performed with antibodies for CK7 (A, D, G, J and M), EpCAM (B, E, H, K and N) and CD56 (C, F, I, L and O). After antigen retrieval, the sections were incubated with antibodies overnight at 37 °C. The black arrow in (H) indicates a bile duct. The sections were examined with a Nikon light microscope. Scale bar represents 50 μm. EpCAM: Epithelial cell adhesion molecule; CK7: Cytokeratin 7; NH: Neonatal hepatitis; CC: Choledochal cyst; BA: Biliary atresia.
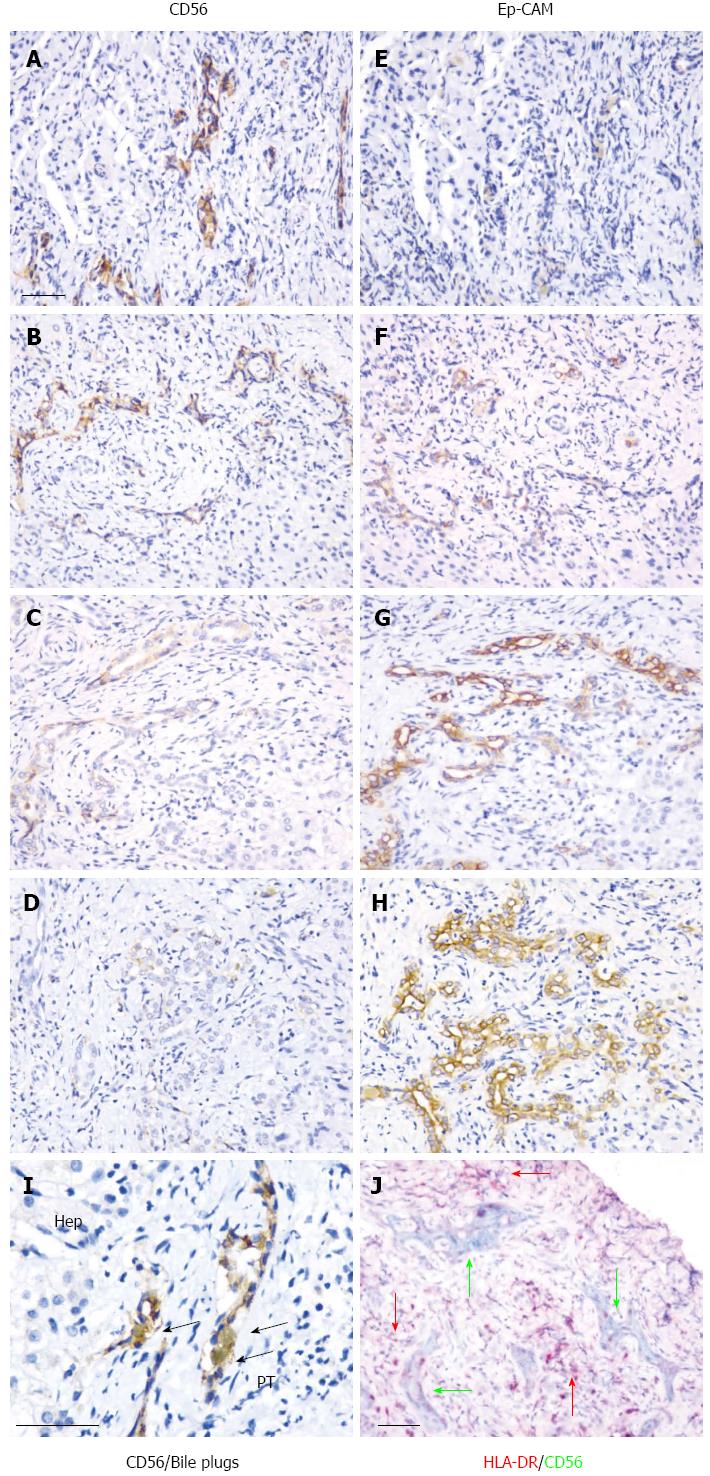
Figure 4 Co-localization of CD56 with epithelial cell adhesion molecule, bile plugs, and human leucocyte antigen-DR.
Co-localization of CD56 (A-D) and EpCAM (E-H) is illustrated in adjacent sections using immunohistochemical staining. From the upper (A, E) to the lower (D, H) slides, the full spectrum of the CD56 staining results is shown. Co-localization of CD56 with bile plugs is shown in (I). Localization of CD56 and HLA-DR positive cells is shown in (J). Black arrows indicate bile plugs. Pink arrows indicate HLA-DR-positive cells. Dark green represents CD56-positive cells. The sections were examined and the scale bar represents 50 μm. Hep: Hepatocytes; PT: Portal tract; EpCAM: Epithelial cell adhesion molecule; HLA-DR: Human leucocyte antigen-DR.
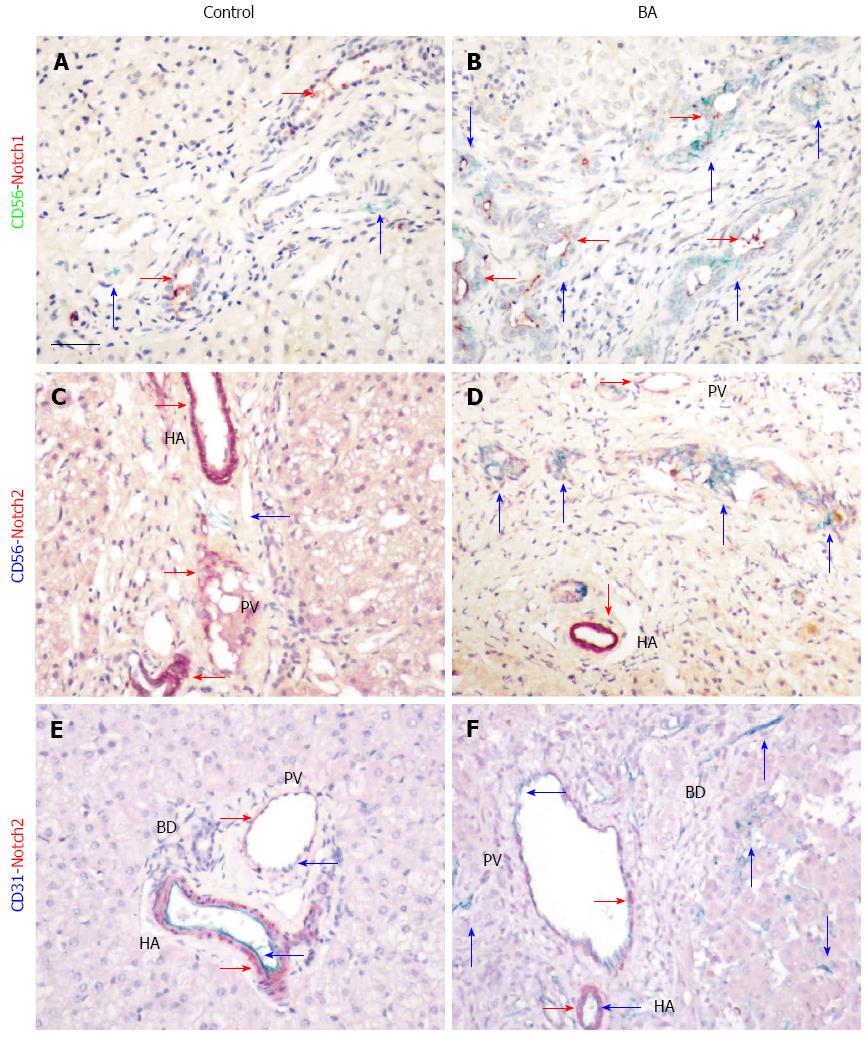
Figure 5 Expression of Notch signaling components in biliary atresia.
Co-localization of CD56-positive cells with Notch1 (A and B) and Notch2 (C and D) is illustrated by immunohistochemical double staining with mouse anti-human CD56 and rabbit anti-human Notch1 and Notch2 using the Polink DS-MR-Hu C1 kit. Positive signals are indicated by arrows, with corresponding colors in the side bars. Scale bar represents 50 μm. BD: Bile duct; HA: Hepatic artery; PV: Portal vein.
- Citation: Zhang RZ, Yu JK, Peng J, Wang FH, Liu HY, Lui VC, Nicholls JM, Tam PK, Lamb JR, Chen Y, Xia HM. Role of CD56-expressing immature biliary epithelial cells in biliary atresia. World J Gastroenterol 2016; 22(8): 2545-2557
- URL: https://www.wjgnet.com/1007-9327/full/v22/i8/2545.htm
- DOI: https://dx.doi.org/10.3748/wjg.v22.i8.2545


