Copyright
©The Author(s) 2016.
World J Gastroenterol. Dec 21, 2016; 22(47): 10341-10352
Published online Dec 21, 2016. doi: 10.3748/wjg.v22.i47.10341
Published online Dec 21, 2016. doi: 10.3748/wjg.v22.i47.10341
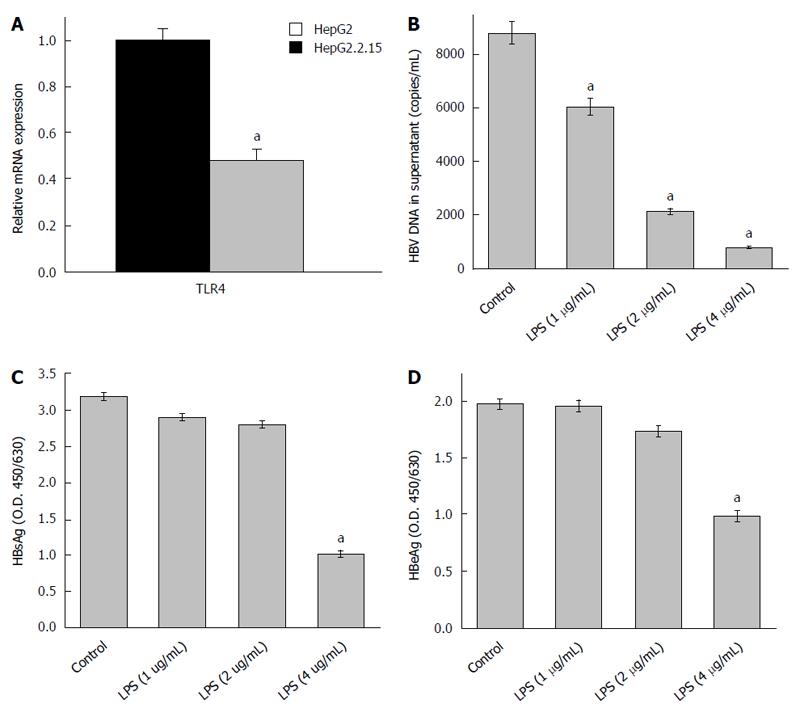
Figure 1 Changes in viral titres on toll like receptor 4 activation with its specific ligand (LPS).
A: mRNA expression of toll like receptor 4 (TLR4) is repressed in HepG2.2.15 cells compared to HepG2 cells. The mRNA expression of TLR4 in HepG2 cells was arbitrarily set as 1, and the fold change in HepG2.2.15 cells was then evaluated. (aP < 0.05). HBV titre was evaluated in the culture supernatant of HepG2.2.15 cells after treatment with 1, 2 and 4 μg/mL of TLR4 ligand (LPS) for 72 h; B: HBV DNA was isolated from the culture media and the load was assessed by absolute real-time PCR using WHO standards. There was a dose dependent decrease in viral load (aP < 0.05); C and D: HBsAg and HBeAg were detected from the culture supernatant of treated cells by ELISA. A dose-dependent repression of viral protein was observed (aP < 0.05).
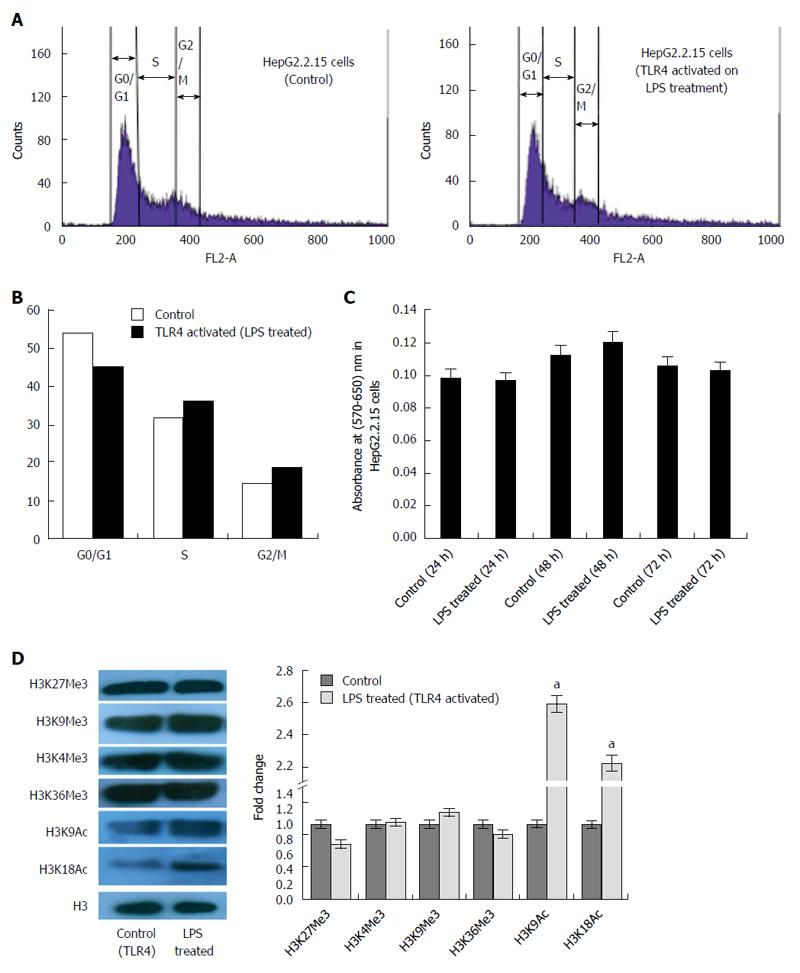
Figure 2 Modification in host cell cycle and expression of epigenetic signatures in HepG2.
2.15 cells on toll like receptor 4 activation with its specific ligand (LPS). A: Flow cytometric analysis of HepG2.2.15 cells after treatment with LPS. Cell cycle analysis showing a partial release of G1/S arrest in treated cells compared to control HepG2.2.15 cells; B: Percentage distribution of cells in different phases of cell cycle showing even distribution of cells in G1 and S phase after LPS treatment; C: MTT assay showing cytotoxicity of LPS in HepG2.2.15 cells. No significant cell death was observed for the chosen concentration of the ligand at different time points; D: Status of epigenetic signatures in HepG2.2.15 cells after stimulation of toll like receptor 4 (TLR4). Protein expression of the methylation marks (H3K4Me3, H3K9Me3, H3K27Me3 and H3K36Me3) did not show significant change. Acetylation marks (H3K9Ac and H3K18Ac) showed an upregulated expression on triggering the cells with LPS (aP < 0.05).
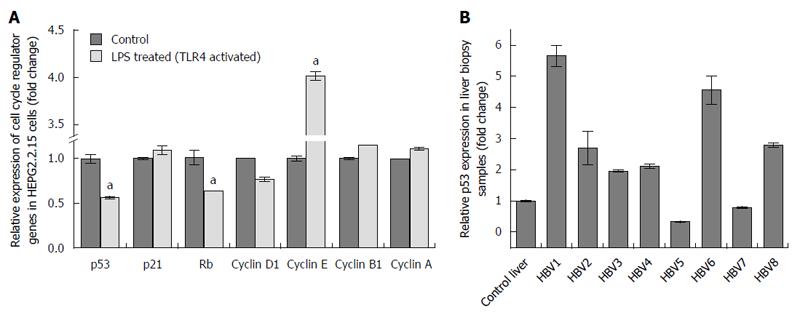
Figure 3 Changes in the expression of cell cycle regulators on toll like receptor 4 activation with its specific ligand (LPS) in HepG2.
2.15 cells and p53 expression in liver biopsy samples from healthy and HBV-infected subjects. A: mRNA expression of the different cell cycle regulators (p53, p21, Rb, Cyclin D1, Cyclin E, Cyclin B1 and Cyclin A) on treating cells with LPS. mRNA expression of the mentioned genes of control HepG2.2.15 cells was arbitrarily set as 1 and the fold change of the treated cells was thereafter evaluated. p53, Rb and Cyclin D1 genes showed repressed mRNA expression in the treated cells. Cyclin E showed upregulated mRNA expression. p21, Cyclin B1 and Cyclin A did not show any significant change (aP < 0.05); B: p53 mRNA expression of liver biopsy samples from CHB patients showed up-regulated expression compared to biopsy samples of control liver (with no history of HBV, HCV and HIV). mRNA expression of p53 in control liver was arbitrarily set as 1 and that in the CHB patients was then evaluated. p53 expression of CHB patients denoted as “HBV1”, “HBV2”, “HBV3”,”HBV4”, “HBV6” AND “HBV8” showed increased expression. TLR4: Toll like receptor 4.
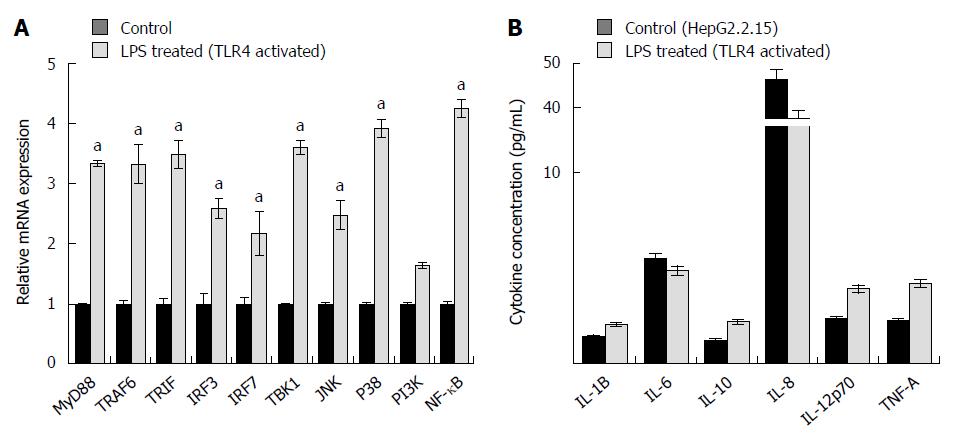
Figure 4 Changes in expression of important toll like receptor 4 pathway signaling molecules and pro-inflammatory cytokines on toll like receptor 4 activation with its specific ligand (LPS).
A: Toll like receptor 4 (TLR4) pathway was stimulated with its specific ligand LPS-B5 Ultrapure. At the specified dose, the signaling molecules involved in TLR4 signaling pathway showed upregulated mRNA expression compared to HepG2.2.15 cells (aP < 0.05); B: Cytokine concentration on triggering the TLR4 pathway. Pro-inflammatory cytokines (IL-1B, IL-10, IL-12p70 and TNF-A) showed increased protein expression on TLR4 activation by using cytokine bead array.
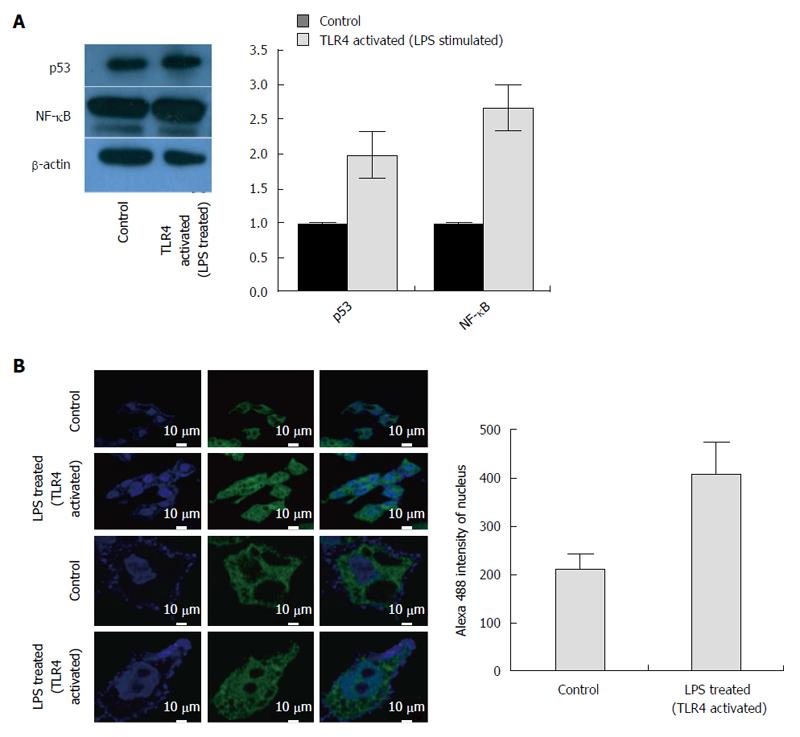
Figure 5 Changes in protein expression and nuclear translocation of nuclear factor-κB on triggering HepG2.
2.15 cells with toll like receptor 4 specific ligand, LPS. A: Protein expression of p53 and nuclear factor-κB (NF-κB) in HepG2.2.15 cells and LPS- treated HepG2.2.15 cells. β-actin was considered as control. Quantitative analysis showed that p53 and NF-κB protein expression was repressed and upregulated respectively in treated cells; B: Confocal imaging showing nuclear uptake of NF-κB p65 subunit from cytoplasm in cells where HepG2.2.15 cells are taken as control and HepG2.2.15 cells stimulated with toll like receptor 4 (TLR4) ligand, LPS. NF-κB concentration was higher in the nucleus of LPS-treated cells compared to control cells.
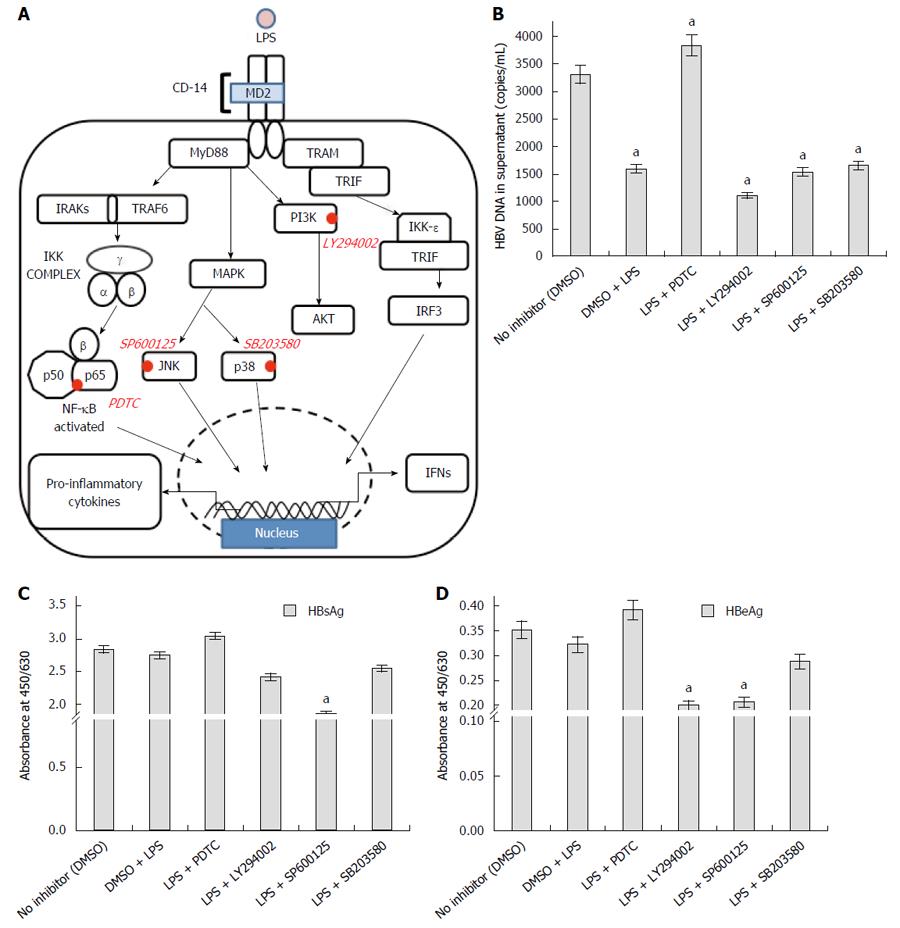
Figure 6 Recruitment of relevant downstream regulator inhibitors in toll like receptor 4 signaling to identify the pathway responsible for its anti-viral action.
A: Pictorial representation of toll like receptor 4 (TLR4) signaling pathway and the important inhibitors of signaling molecules have been highlighted; B: HBV DNA was evaluated in the supernatant from cells pre-treated with LPS, singly or in conjunction with the inhibitors. Anti-viral action of TLR4 was abolished on blocking the TLR4 pathway with PDTC (NF-κB inhibitor) (aP < 0.05); C, D: Viral proteins (HBsAg and HBeAg) showed highest concentration on using PDTC. The antiviral action of TLR4 is probably operated through NF-κB pathway (aP < 0.05).
- Citation: Das D, Sarkar N, Sengupta I, Pal A, Saha D, Bandopadhyay M, Das C, Narayan J, Singh SP, Chakravarty R. Anti-viral role of toll like receptor 4 in hepatitis B virus infection: An in vitro study. World J Gastroenterol 2016; 22(47): 10341-10352
- URL: https://www.wjgnet.com/1007-9327/full/v22/i47/10341.htm
- DOI: https://dx.doi.org/10.3748/wjg.v22.i47.10341


