Copyright
©The Author(s) 2016.
World J Gastroenterol. Oct 7, 2016; 22(37): 8414-8434
Published online Oct 7, 2016. doi: 10.3748/wjg.v22.i37.8414
Published online Oct 7, 2016. doi: 10.3748/wjg.v22.i37.8414
Figure 1 Proportion of patients who responded poorly to neo-adjuvant therapy.
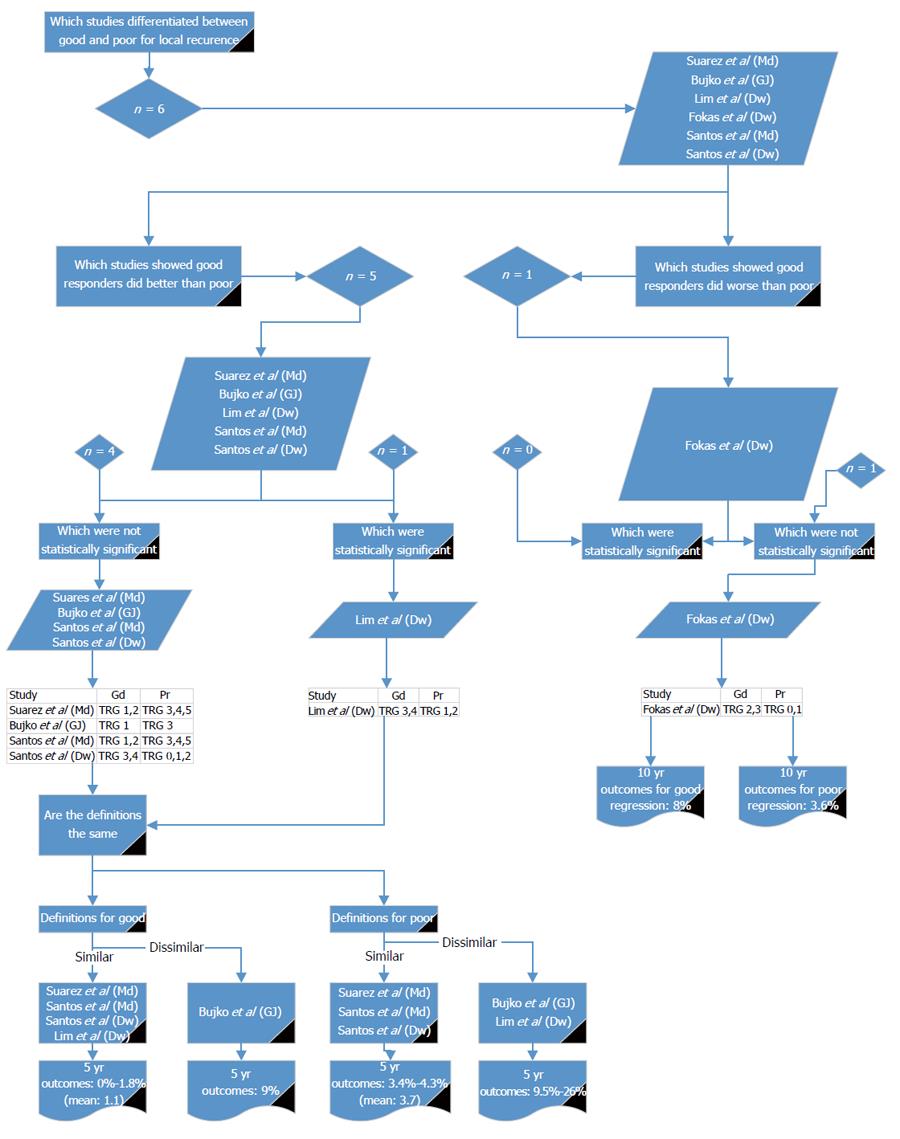
Figure 2 Studies reporting on local recurrence in good and poor responders.
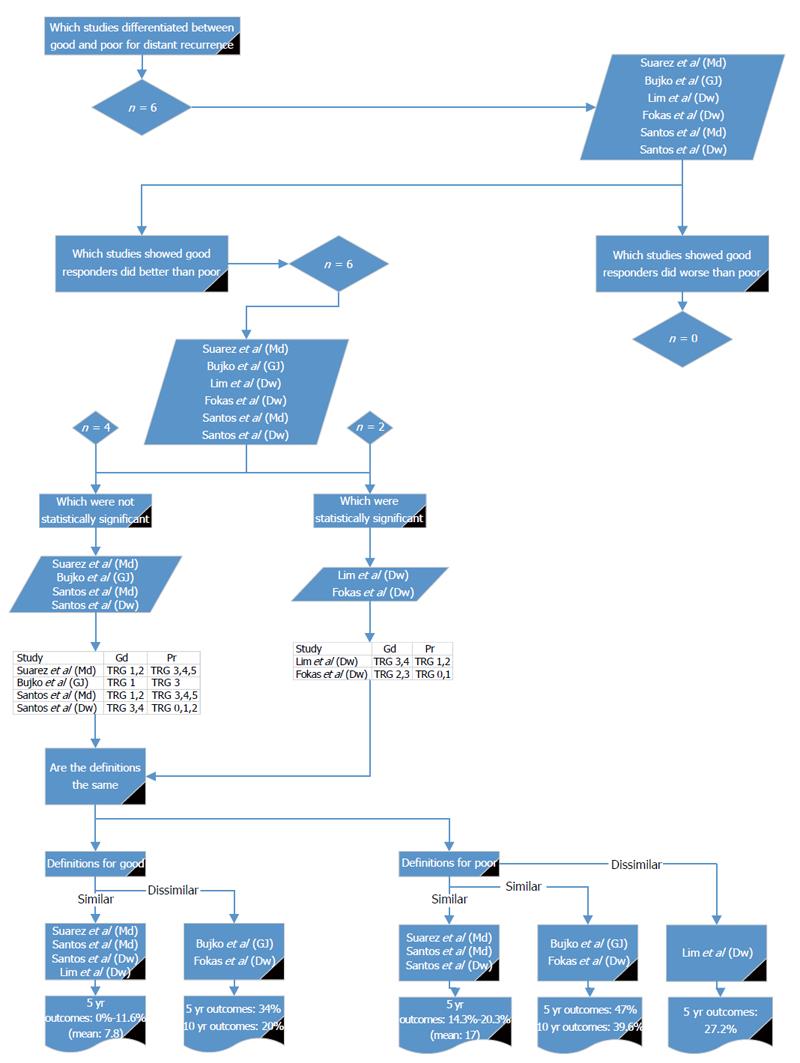
Figure 3 Studies reporting on distant recurrence in good and poor responders.
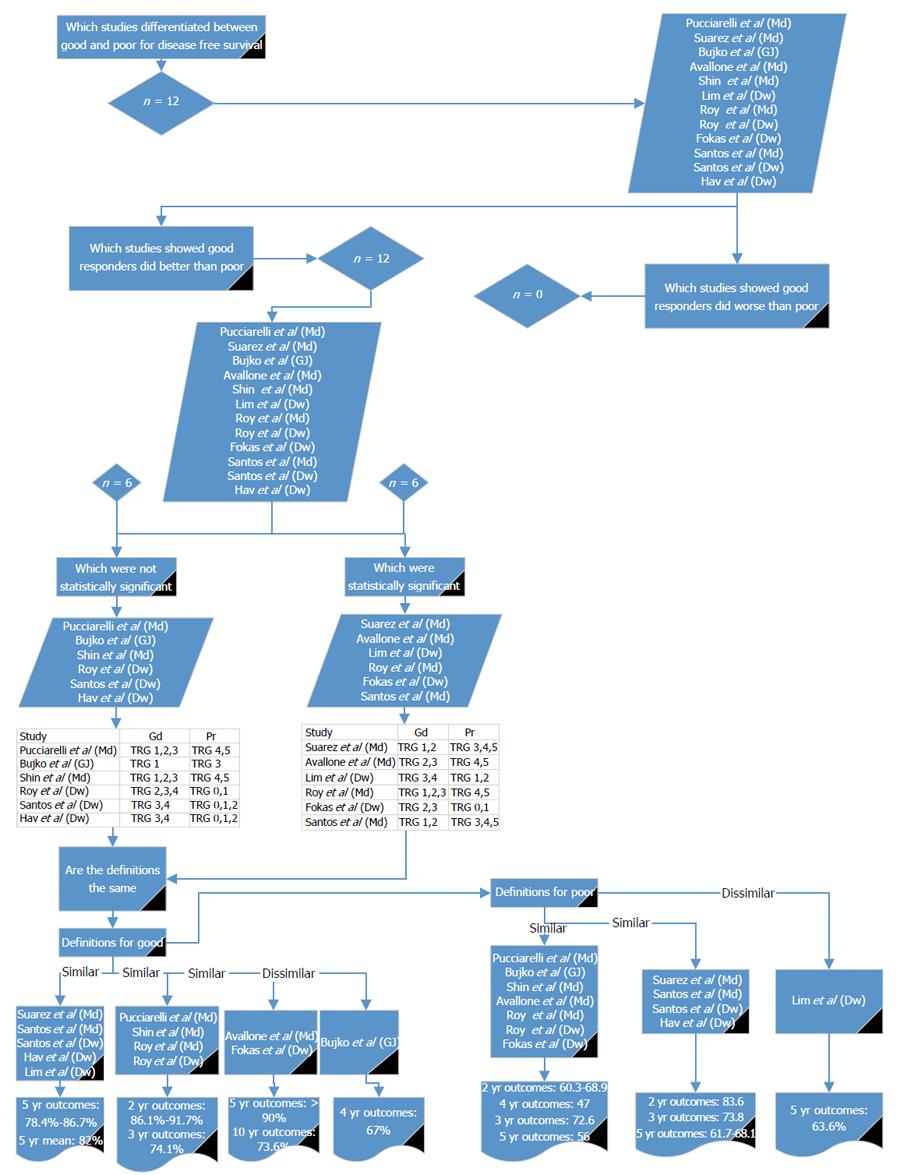
Figure 4 Studies reporting on disease- free survival in good and poor responders.
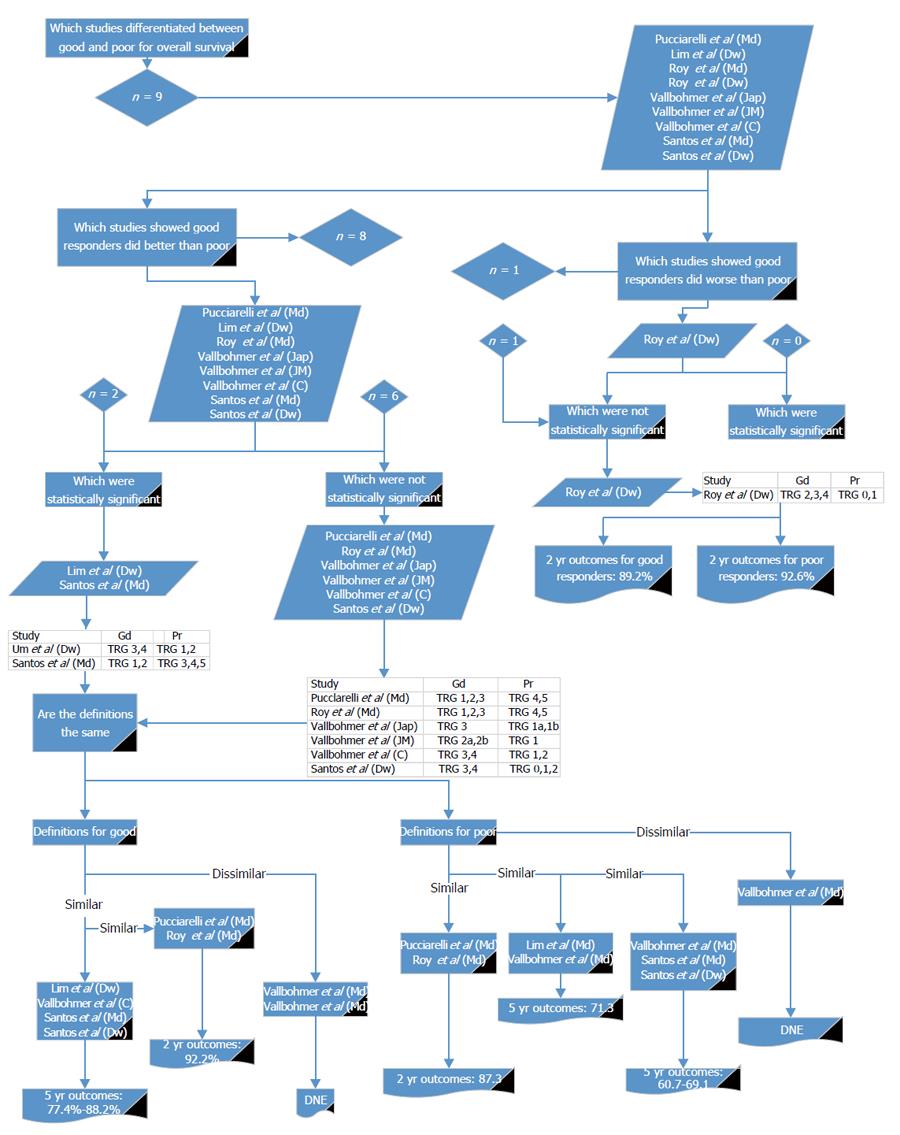
Figure 5 Studies reporting on overall survival in good and poor responders.
Figure 6 Proportion of patients who responded poorly to neo-adjuvant therapy according to magnetic resonance imaging.
Figure 7 Funnel plot for studies reporting on the prevalence of poor response according to histology.
- Citation: Siddiqui MRS, Bhoday J, Battersby NJ, Chand M, West NP, Abulafi AM, Tekkis PP, Brown G. Defining response to radiotherapy in rectal cancer using magnetic resonance imaging and histopathological scales. World J Gastroenterol 2016; 22(37): 8414-8434
- URL: https://www.wjgnet.com/1007-9327/full/v22/i37/8414.htm
- DOI: https://dx.doi.org/10.3748/wjg.v22.i37.8414


