Copyright
©The Author(s) 2016.
World J Gastroenterol. Sep 14, 2016; 22(34): 7841-7850
Published online Sep 14, 2016. doi: 10.3748/wjg.v22.i34.7841
Published online Sep 14, 2016. doi: 10.3748/wjg.v22.i34.7841
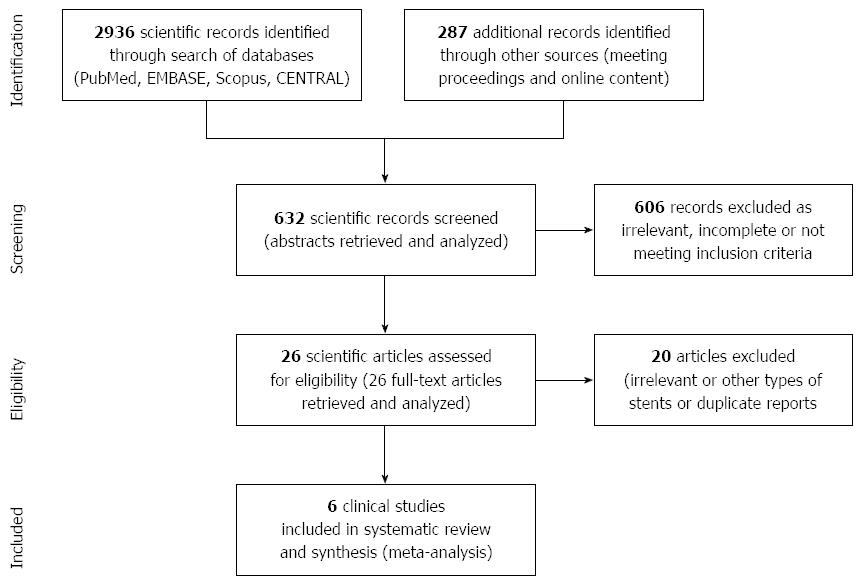
Figure 1 PRISMA selection.
Study selection process according to the PRISMA statement by the Cochrane Collaboration.
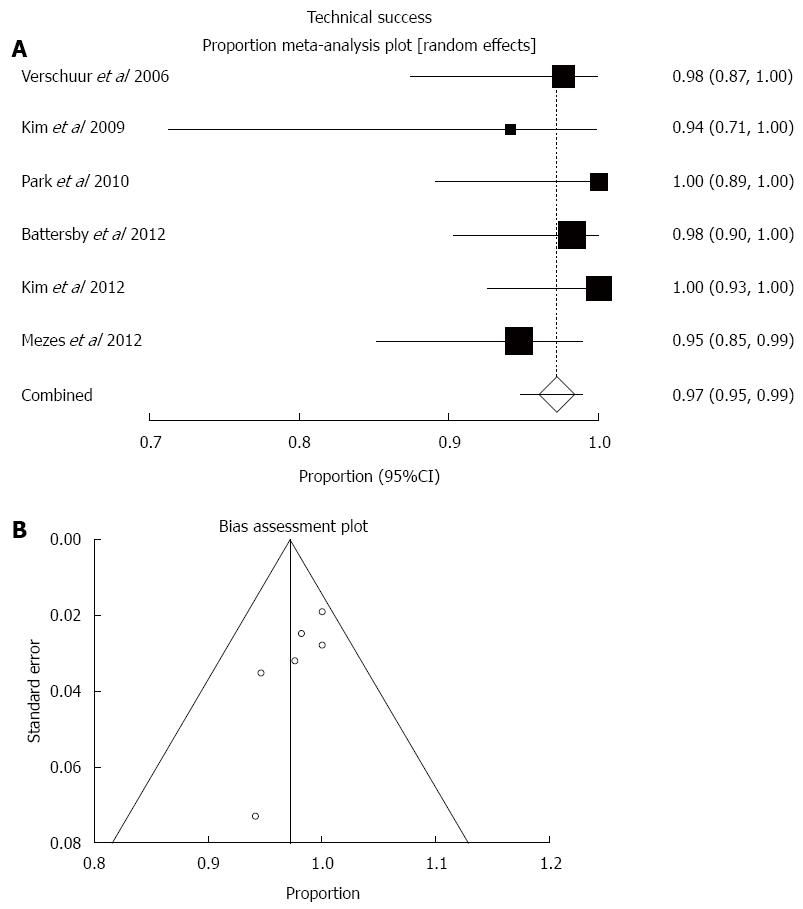
Figure 2 Technical success.
A: Random effects forest plot of weighted pooled estimate; B: Respective funnel plot for bias assessment (the standard error of the proportion was plotted against the proportion for each study).
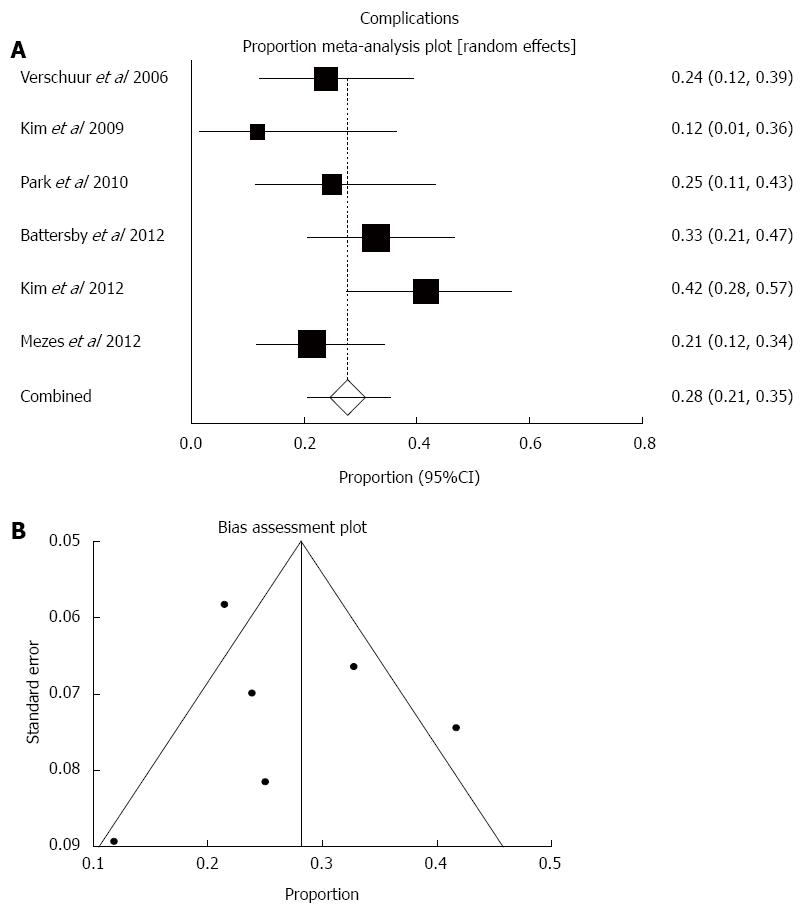
Figure 3 Complications.
A: Random effects forest plot of weighted pooled estimate; B: Respective funnel plot for bias assessment (the standard error of the proportion was plotted against the proportion for each study).
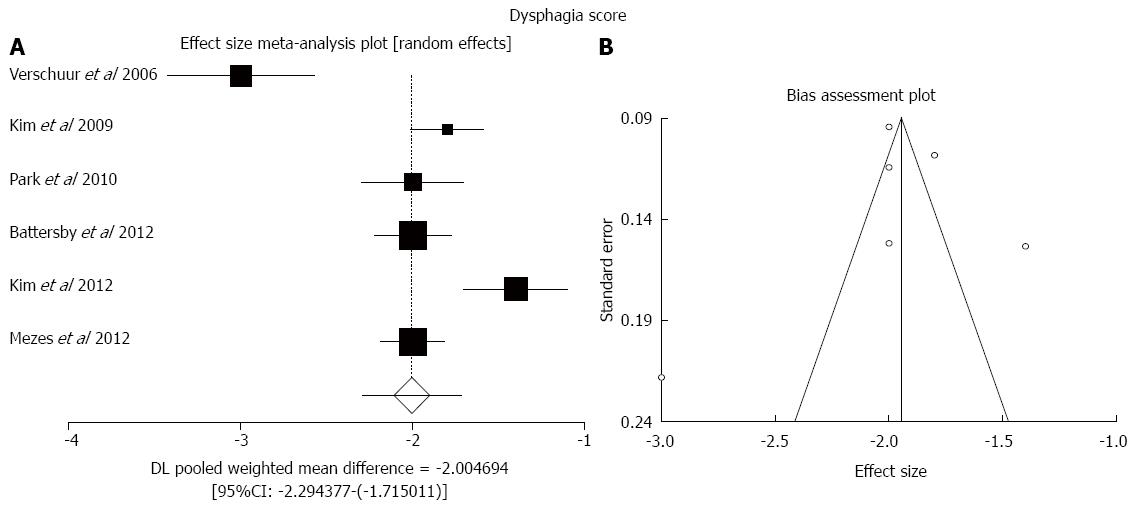
Figure 4 Improvement of dysphagia score.
A: Random effects forest plot of weighted pooled treatment effect; B: Respective funnel plot for bias assessment (the standard error of the score was plotted against the effect size for each study).
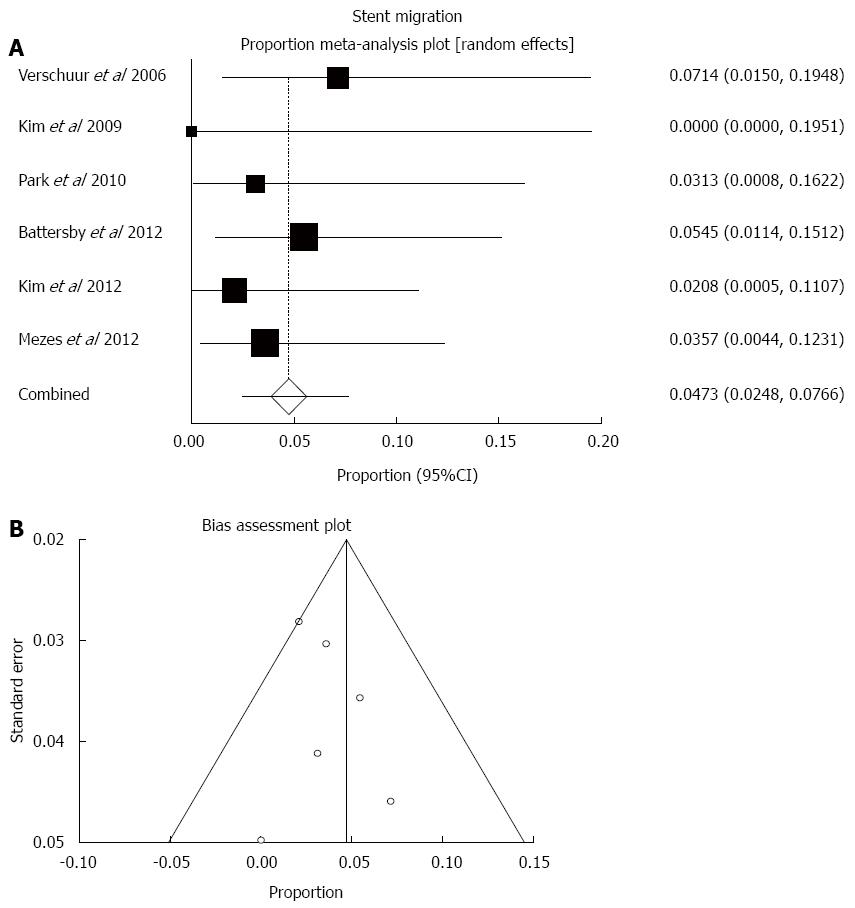
Figure 5 Stent migration.
A: Random effects forest plot of weighted pooled estimate; B: Respective funnel plot for bias assessment (the standard error of the proportion was plotted against the proportion for each study).
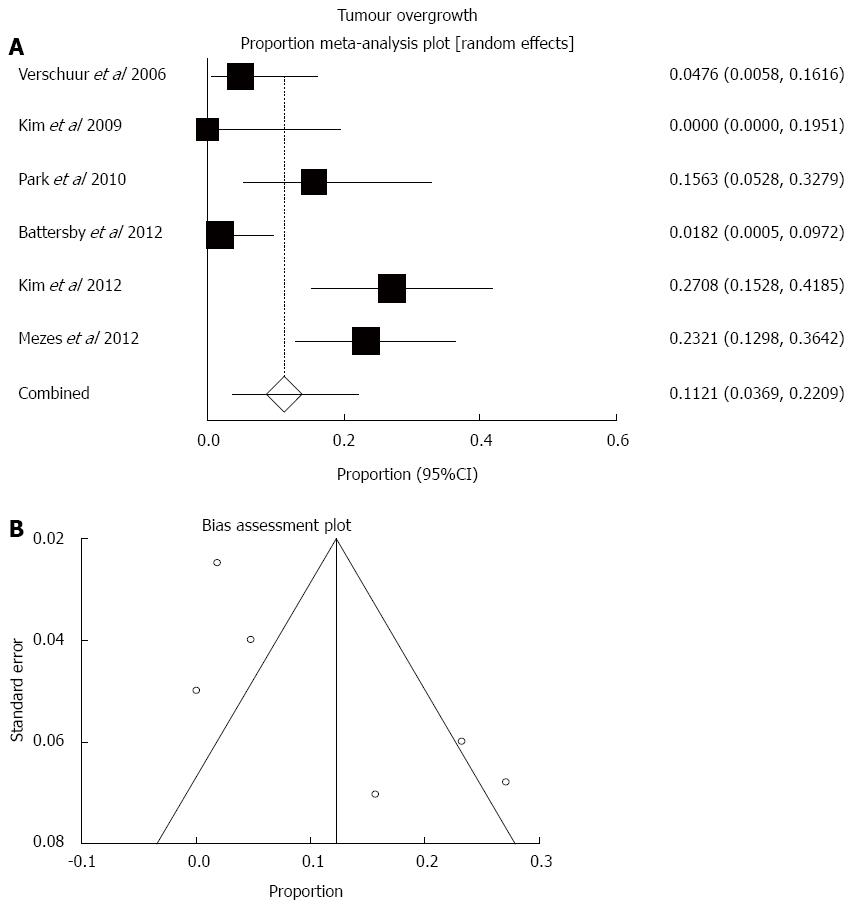
Figure 6 Tumour overgrowth.
A: Random effects forest plot of weighted pooled estimate; B: Respective funnel plot for bias assessment (the standard error of the proportion was plotted against the proportion for each study).
- Citation: Hussain Z, Diamantopoulos A, Krokidis M, Katsanos K. Double-layered covered stent for the treatment of malignant oesophageal obstructions: Systematic review and meta-analysis. World J Gastroenterol 2016; 22(34): 7841-7850
- URL: https://www.wjgnet.com/1007-9327/full/v22/i34/7841.htm
- DOI: https://dx.doi.org/10.3748/wjg.v22.i34.7841


