Copyright
©The Author(s) 2016.
World J Gastroenterol. Jun 28, 2016; 22(24): 5589-5597
Published online Jun 28, 2016. doi: 10.3748/wjg.v22.i24.5589
Published online Jun 28, 2016. doi: 10.3748/wjg.v22.i24.5589
Figure 1 Expression of miR-422a in colorectal cancer and its association with TNM stage.
A: Levels of miR-422a were determined in 102 colorectal cancer (CRC) tissues and their corresponding normal mucosa (NC); B: The fold changes of relative miR-422a level (CRC/NC) in each matched samples, with “< -1” defined as under-expression, “-1-1” as unchanged, and “> 1” as overexpression; C: Levels of miR-422a in stages I/II/III CRC.
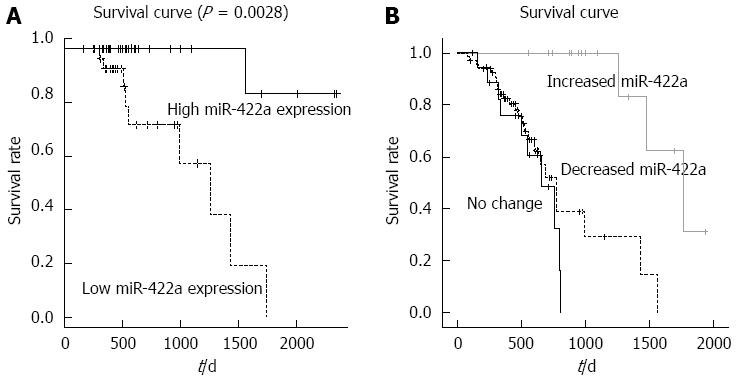
Figure 2 Kaplan-Meier curves for overall survival in 102 colorectal cancer patients based on miR-422a expression and the change of miR-422a expression compared to adjacent normal mucosa, respectively.
Results showed that patients with low miR-422a expression had a significantly poorer prognosis than those with high miR-422a expression (A) (P = 0.0028), and patients with decreased miR-422a expression compared to adjacent normal mucosa had a significantly poorer prognosis than those with increased miR-422a expression (B) (P < 0.001).
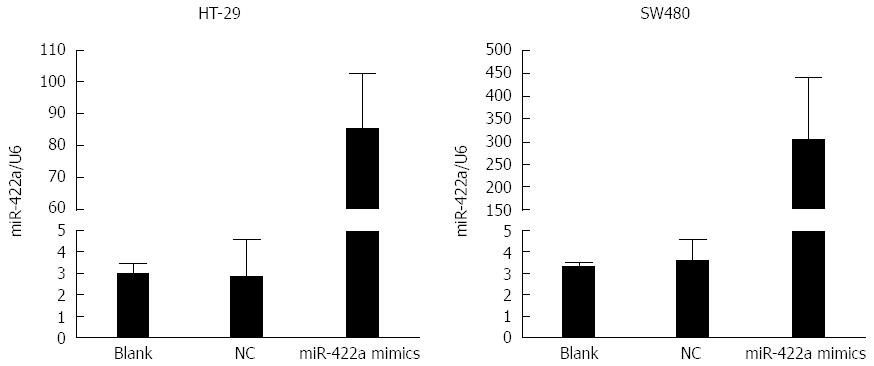
Figure 3 Transfection efficiency assays.
The expression of miR-422a in HT-29 and SW480 cells was significantly increased after transfection with the mimics. All experiments were performed in triplicate.
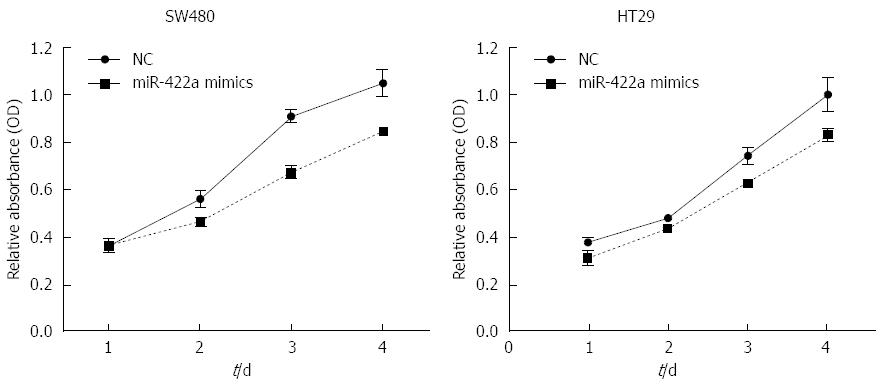
Figure 4 Overexpression of miR-422a inhibits colorectal cancer cell proliferation.
Growth curves of miR-422a mimics and negative control mimicstransfected CRC cells were plotted after CCK8 assay in SW480 and HT29 cells. All experiments were performed in triplicate. NC: Negative control.
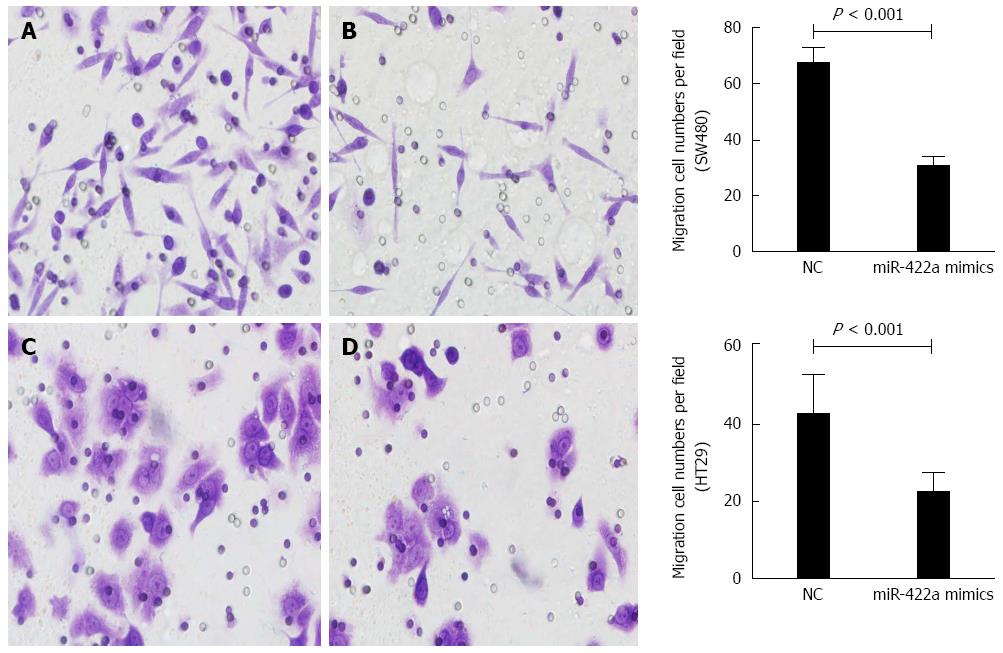
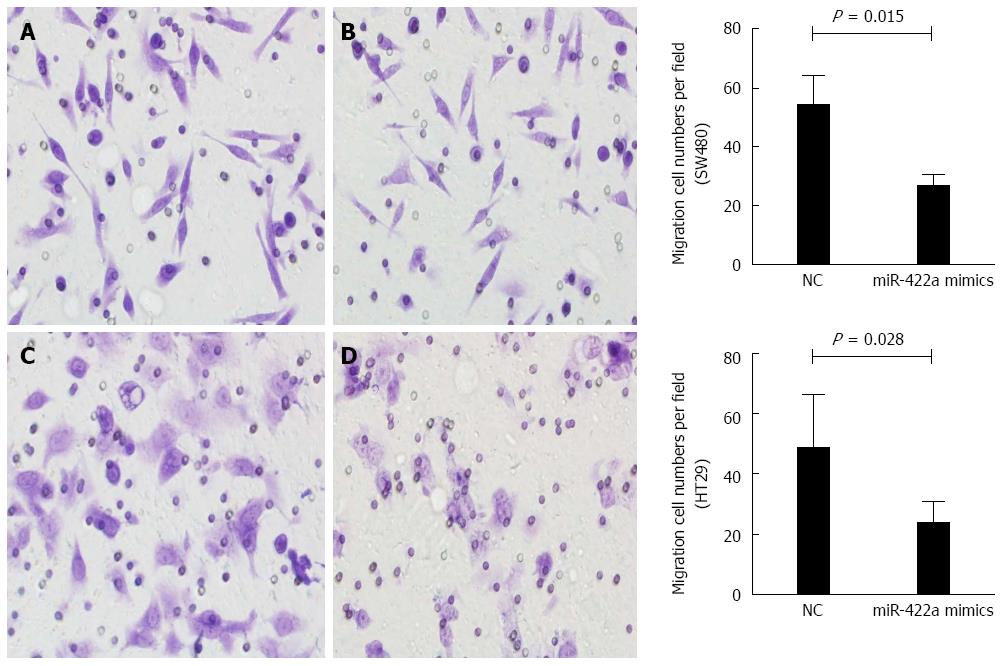
Figure 5 Effect of miR-422a overexpression on cell migration.
Overexpression of miR-422a significantly inhibited the migration of SW480 (A and B) and HT29 (C and D) cells after transient transfection with miR-422a mimics. Stained cells were counted in five randomly selected fields under a light microscope. Representative photographs (left) and quantification (right) are shown. Magnification: × 400. All assays were performed in triplicate to derive the confidence intervals.
Figure 6 Effect of miR-422a overexpression on cell invasion.
Overexpression of miR-422a significantly inhibited the invasiveness of in SW480 (A and B) and HT29 (C and D) cells after transient transfection with miR-422A mimics. Stained cells were counted in five randomly selected fields under a light microscope. Representative photographs (left) and quantification (right) are shown. Magnification: × 400. All assays were performed in triplicate to derive the confidence intervals.
- Citation: Zheng GX, Qu AL, Yang YM, Zhang X, Zhang SC, Wang CX. miR-422a is an independent prognostic factor and functions as a potential tumor suppressor in colorectal cancer. World J Gastroenterol 2016; 22(24): 5589-5597
- URL: https://www.wjgnet.com/1007-9327/full/v22/i24/5589.htm
- DOI: https://dx.doi.org/10.3748/wjg.v22.i24.5589


