Copyright
©The Author(s) 2016.
World J Gastroenterol. Jun 21, 2016; 22(23): 5374-5383
Published online Jun 21, 2016. doi: 10.3748/wjg.v22.i23.5374
Published online Jun 21, 2016. doi: 10.3748/wjg.v22.i23.5374
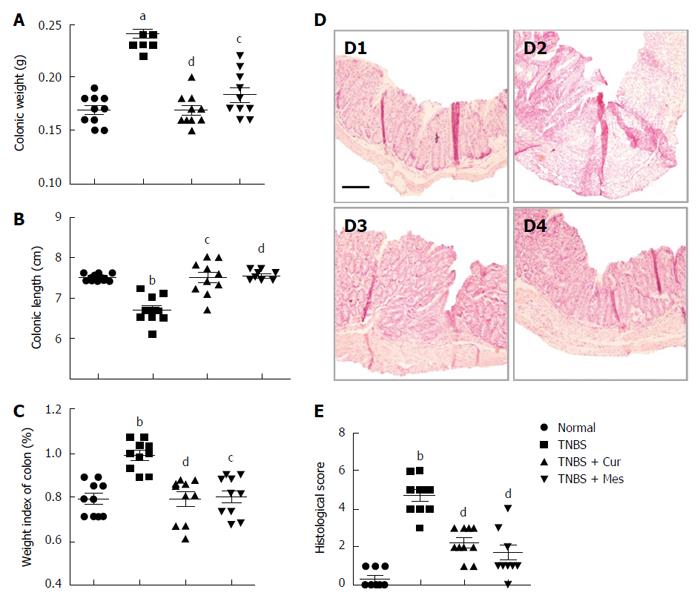
Figure 1 Histological evaluation.
A: Colonic weight; B: Colonic length; C: Weight index of the colon; D: Typical histological images stained with HE. D1, D2, D3 and D4, respectively, represent the normal, TNBS, TNBS + Cur and TNBS + Mes groups. Bar = 200 μm; E: Histological scores. Data are presented as mean ± SE (n = 10). aP < 0.05 and bP < 0.01 vs normal group; cP < 0.05 and dP < 0.01 vs TNBS group.
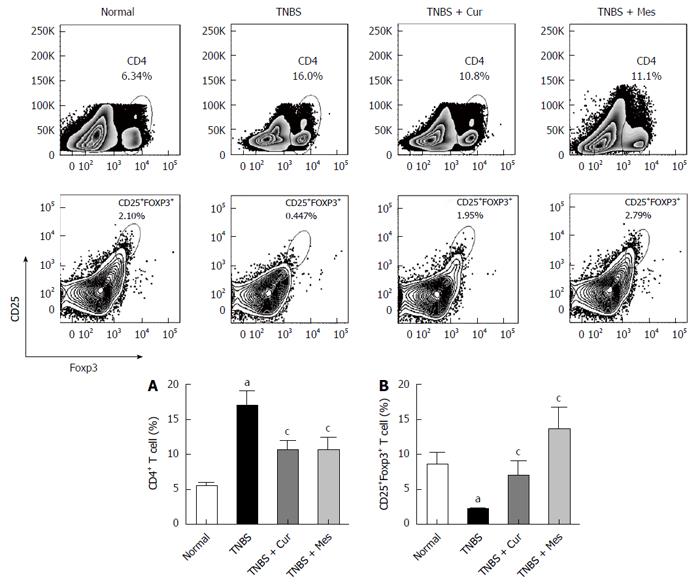
Figure 2 Typical graphs and levels of CD4+ and CD25+Foxp3+ T cells.
Lymphocytes were isolated from GALT of normal mice or mice with TNBS-induced colitis, and analyzed by flow cytometry. A: Typical graphs and levels (MFI) of CD4+ T cells; B: Typical graphs and levels (MFI) of CD25+Foxp3+ T cells. Data are expressed as mean ± SE (n = 8). aP < 0.05 vs normal group; cP < 0.05 vs TNBS group.
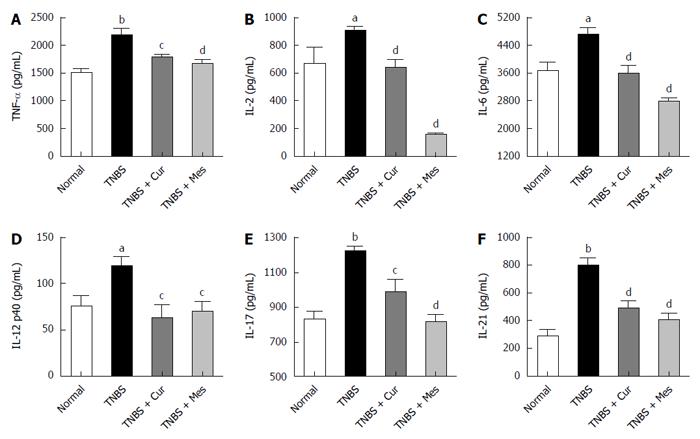
Figure 3 Concentrations of cytokines in the colonic mucosa.
The tissue supernatant was prepared from the colonic mucosa in all mice. The levels of cytokines were analyzed by ELISA. A: Concentrations of TNF-α in the colonic mucosa from different groups; B: Concentrations of IL-2 in the colonic mucosa from different groups; C: Concentrations of IL-6 in the colonic mucosa from different groups; D: Concentrations of IL-12 p40 in the colonic mucosa from different groups; E: Concentrations of IL-17 in the colonic mucosa from different groups; F: Concentrations of IL-21 in the colonic mucosa from different groups. Data are expressed as mean ± SE (n = 8). aP < 0.05 and bP < 0.01 vs normal group; cP < 0.05 and dP < 0.01 vs TNBS group.
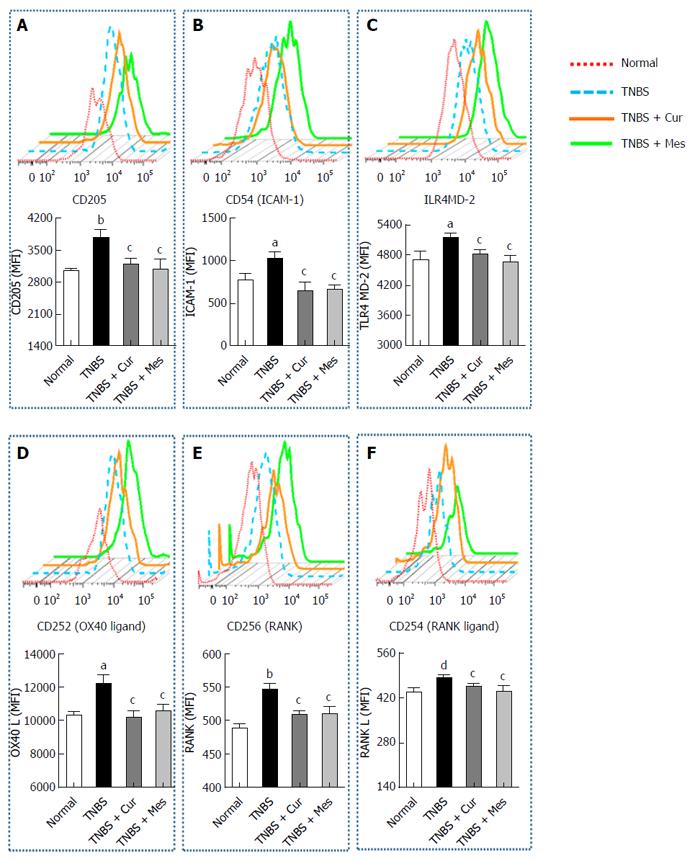
Figure 4 Typical curves and levels of costimulatory molecules in dendritic cells.
Lymphocytes were isolated from GALT of normal mice or mice with TNBS-induced colitis, and analyzed by flow cytometry. A: Typical pseudocolor and level (MFI) of CD205; B: Typical pseudocolor and level (MFI) of CD54(ICAM-1); C:Typical pseudocolor and level (MFI) of TLR4; D: Typical pseudocolor and level (MFI) of CD252 (OX40 L); E: Typical pseudocolor and level (MFI) of CD256 (RNAK); F: Typical pseudocolor and level (MFI) of CD254 (RNAK L). Data are expressed as mean ± SE (n = 8). aP < 0.05 and bP < 0.01 vs normal group; cP < 0.05 and dP < 0.01 vs TNBS group.
- Citation: Zhao HM, Xu R, Huang XY, Cheng SM, Huang MF, Yue HY, Wang X, Zou Y, Lu AP, Liu DY. Curcumin improves regulatory T cells in gut-associated lymphoid tissue of colitis mice. World J Gastroenterol 2016; 22(23): 5374-5383
- URL: https://www.wjgnet.com/1007-9327/full/v22/i23/5374.htm
- DOI: https://dx.doi.org/10.3748/wjg.v22.i23.5374


