Copyright
©The Author(s) 2016.
World J Gastroenterol. Jun 7, 2016; 22(21): 5042-5049
Published online Jun 7, 2016. doi: 10.3748/wjg.v22.i21.5042
Published online Jun 7, 2016. doi: 10.3748/wjg.v22.i21.5042
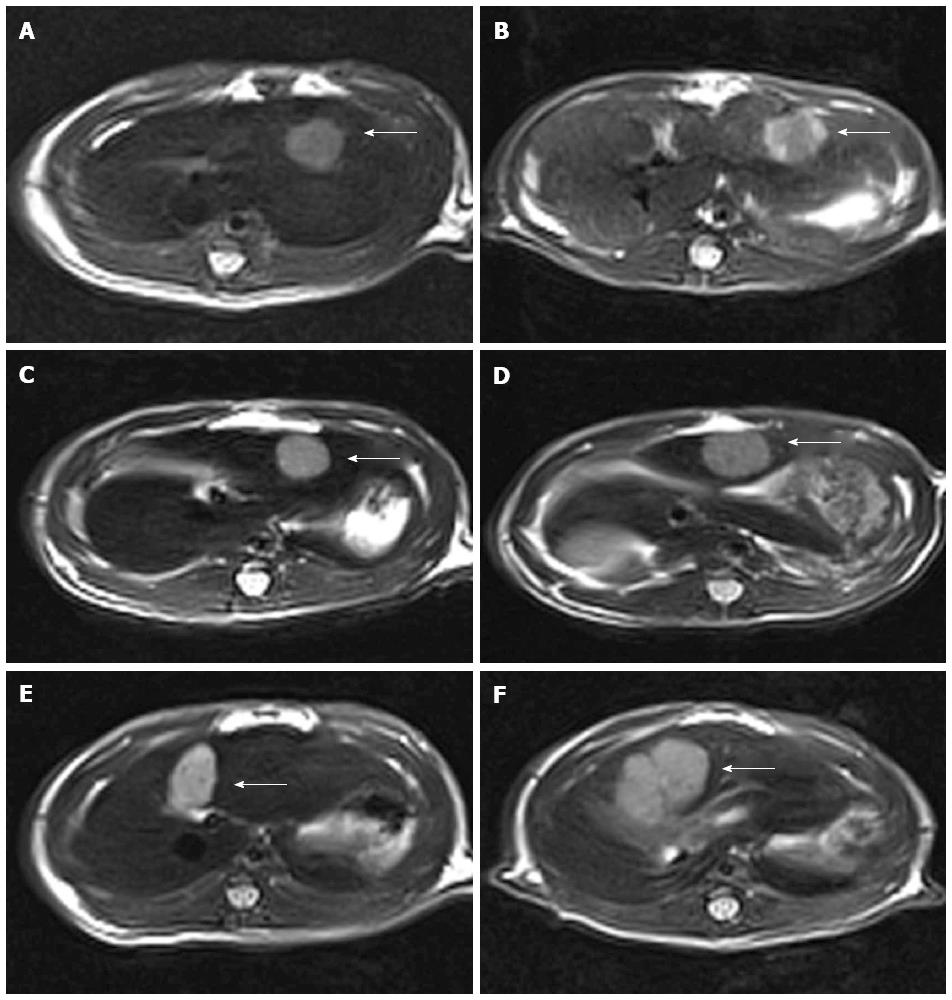
Figure 1 Representative transverse magnetic resonance images of solid liver tumors in group A (TACE+ GRGDSP loaded nanoparticles) (images A and B), group B (Control group 1, TACE+ GRGDSP) (images C and D) and group C (Control group 2, TACE alone) (images E and F) in ACI rats.
3870/80 matrix was acquired for all images. A: The pretreatment unenhanced T2-weighted TSE MR image shows a small hyperintense tumor (arrow) in the left lateral liver lobe (0.81 cm × 0.79 cm); B: On the posttreatment unenhanced T2-weighted TSE MR image, the same lesion (arrow) (0.85 cm × 0.82 cm) is a hyperintense tumor and has the inhomogeneous hypointense area corresponding to intratumoral necrosis. The growth of the hepatic tumor is noticeably inhibited after therapy; C: The pretreatment unenhanced T2-weighted TSE MR image shows a small hyperintense tumor (arrow) in the left lateral liver lobe (0.75 cm × 0.70 cm); D: On the posttreatment unenhanced T2-weighted TSE MR image, the same lesion (arrow) (1.03 cm × 0.87 cm) is a hyperintense tumor and has the inhomogeneous hypointense area corresponding to intratumoral necrosis. The hepatic tumor appears to have grown slightly after therapy; E: The pretreatment unenhanced T2-weighted TSE MR image shows a small hyperintense tumor (arrow) in the left lateral liver lobe (0.74 cm × 0.71 cm); F: On the posttreatment unenhanced T2-weighted TSE MR image, the same lesion appears as a 1.23 cm × 1.01 cm tumor (arrow) with relatively rapid growth compared to its size before therapy. TACE: Transarterial chemoembolization.
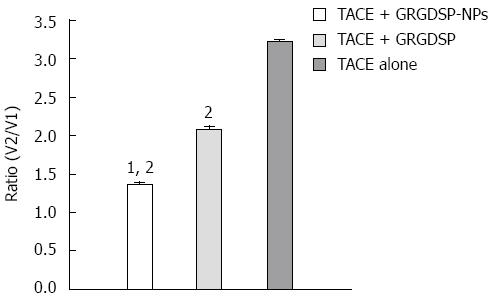
Figure 2 The mean tumor growth ratio (V2/V1) by magnetic resonance imaging from each group.
The mean tumor growth ratio (V2/V1) by MRI showed significant differences between group A (TACE + GRGDSP loaded nanoparticles), group B (control group 1, TACE + GRGDSP) and group C (control group 2, TACE alone) (P < 0.01). TACE: Transarterial chemoembolization. 1Compared with group B (control group 1, TACE + GRGDSP); 2Compared with group C (control group 2, TACE alone).
Figure 3 Immunohistochemical staining of VEGF in hepatocellular carcinoma in group A (TACE + GRGDSP loaded nanoparticles), group B (Control group 1, TACE + GRGDSP) and group C (Control group 2, TACE alone) (magnification × 100).
A: VEGF expression in hepatocellular carcinoma in group A. B: Higher expression of VEGF in hepatocellular carcinoma was observed in group B than in group A; C: Higher immunohistochemical expression of VEGF in hepatocellular carcinoma was observed in group C than in groups A and B. VEGF: Vascular endothelial growth factor; TACE: Transarterial chemoembolization.
Figure 4 Immunohistochemical staining of matrix metalloprotein 9 in hepatocellular carcinoma in group A (TACE + GRGDSP loaded nanoparticles), group B (Control group 1, TACE + GRGDSP) and group C (Control group 2, TACE alone) (magnification × 100).
A: Immunohistochemical staining of MMP-9 in hepatocellular carcinoma in group A. B: Higher immunohistochemical expression of MMP-9 in hepatocellular carcinoma was observed in group B than in group A. C: Higher immunohistochemical expression of MMP-9 in hepatocellular carcinoma was observed in group C than in groups A and B. MMP-9: Matrix metalloprotein 9; TACE: Transarterial chemoembolization.
- Citation: Qian J, Oppermann E, Tran A, Imlau U, Qian K, Vogl TJ. Transarterial administration of integrin inhibitor loaded nanoparticles combined with transarterial chemoembolization for treating hepatocellular carcinoma in a rat model. World J Gastroenterol 2016; 22(21): 5042-5049
- URL: https://www.wjgnet.com/1007-9327/full/v22/i21/5042.htm
- DOI: https://dx.doi.org/10.3748/wjg.v22.i21.5042


