Copyright
©The Author(s) 2016.
World J Gastroenterol. Jun 7, 2016; 22(21): 5012-5022
Published online Jun 7, 2016. doi: 10.3748/wjg.v22.i21.5012
Published online Jun 7, 2016. doi: 10.3748/wjg.v22.i21.5012
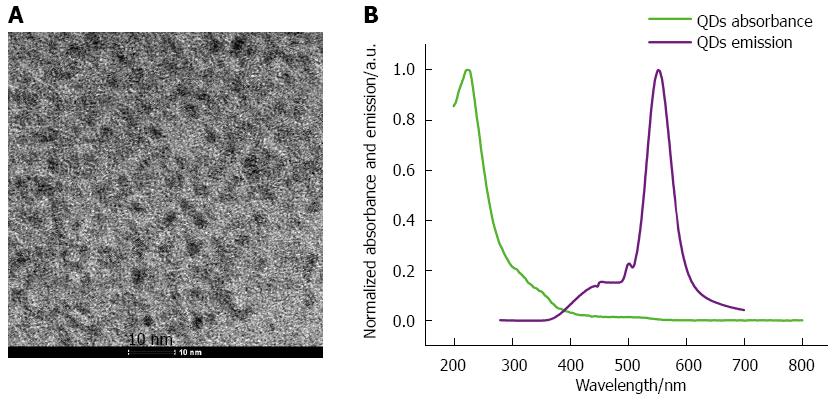
Figure 1 Characterization of CdSe/ZnS quantum dots.
A: TEM image of CdSe/ZnS QDs; B: Absorbance and emission of CdSe/ZnS QDs. QDs: Quantum dots.
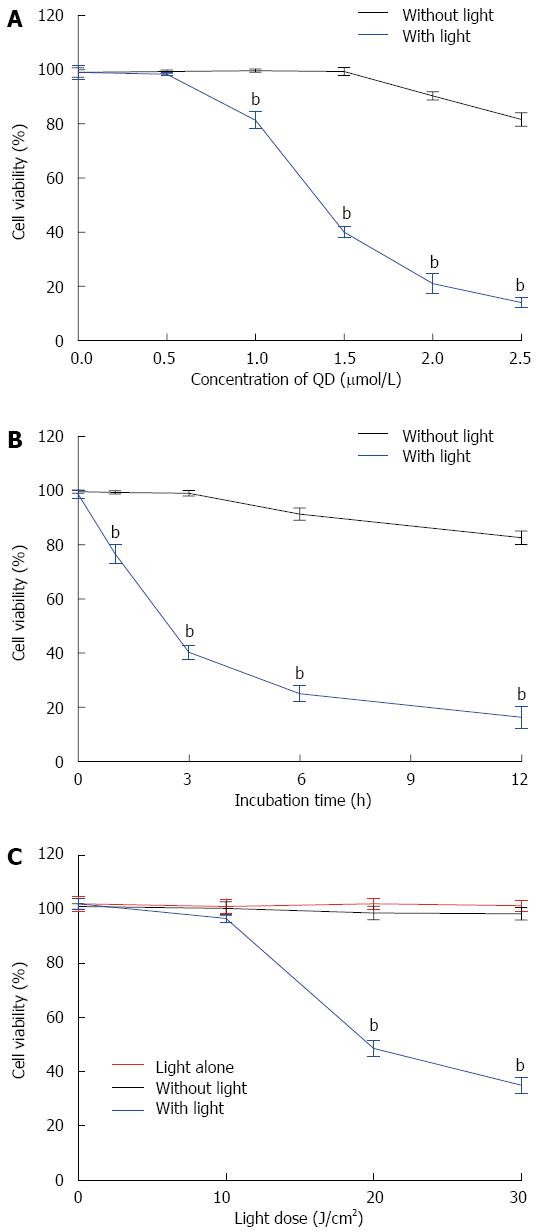
Figure 2 Cell viability of SW1990 cells was inhibited by CdSe/ZnS quantum dots with or without illumination.
A: SW1990 cells were treated with various concentrations of CdSe/ZnS QDs (0, 0.5, 1.0, 1.5, 2.0, 2.5 μmol/L); incubation time was 3 h; light dose was 20 J/cm2; B: SW1990 cells incubated with CdSe/ZnS QDs (1.5 μmol/L) for 0, 1, 3, 6 and 12 h and illuminated (light dose was 20 J/cm2); C: SW1990 cells alone or incubated with CdSe/ZnS QDs (1.5 μmol/L) for 3 h and illuminated with different light doses (0, 10, 20 and 30 J/cm2). bP < 0.01 vs related group without light. QDs: Quantum dots.
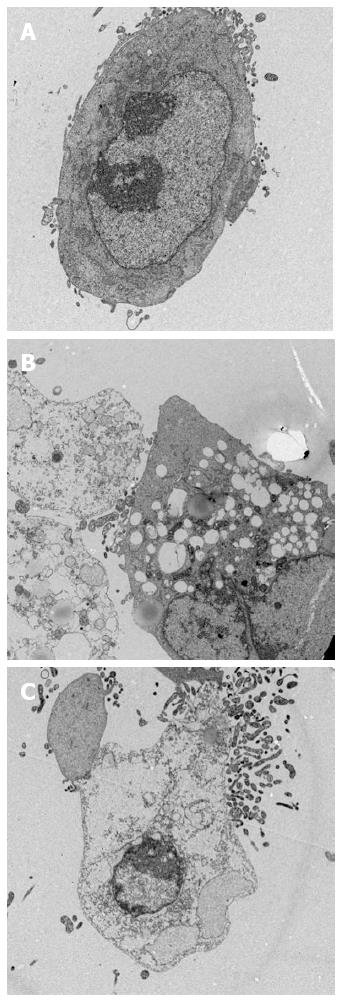
Figure 3 Ultrastructural changes in SW1990 cells induced by CdSe/ZnS quantum dots with or without illumination (TEM, magnification × 2000).
A: normal SW1990 cells; B: treated with CdSe/ZnS QDs (1.5 μmol/L, 3 h) and illumination (20 J/cm2); C: treated with CdSe/ZnS QDs (2 μmol/L, 3 h) and illumination (20 J/cm2). QDs: Quantum dots.
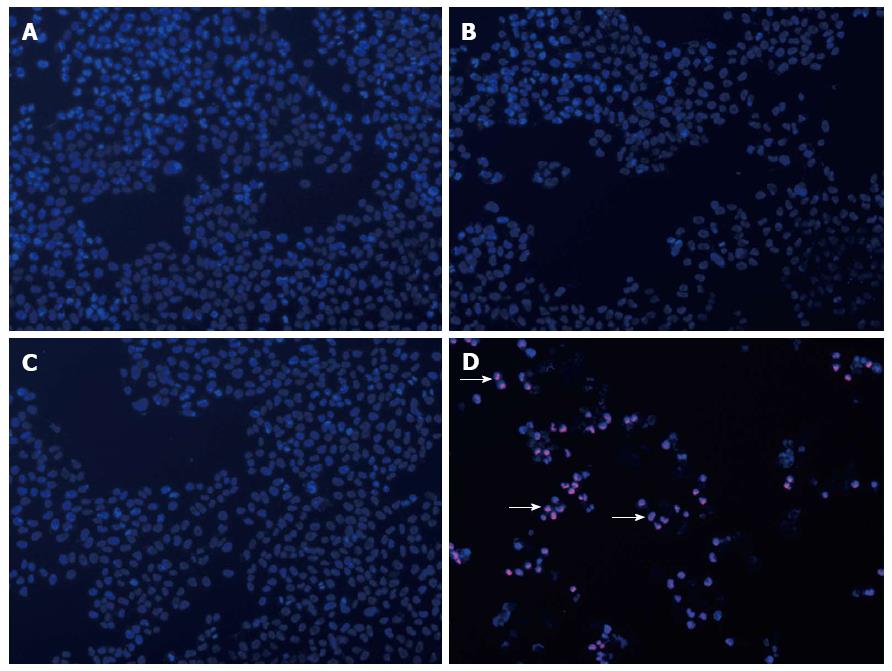
Figure 4 Apoptosis and necrosis were observed in SW1990 cells treated by CdSe/ZnS quantum dots with illumination (Hochest 33342/PI nucleus staining, magnification × 100).
A: normal SW1990 cells; B: SW1990 cells with illumination (20 J/cm2); C: SW1990 cells treated with CdSe/ZnS QDs (1.5 μmol/L, 3 h); D: SW1990 cells treated with CdSe/ZnS QDs (1.5 μmol/L, 3 h) and illumination (20 J/cm2). The white arrow shows dead cells. QDs: Quantum dots.
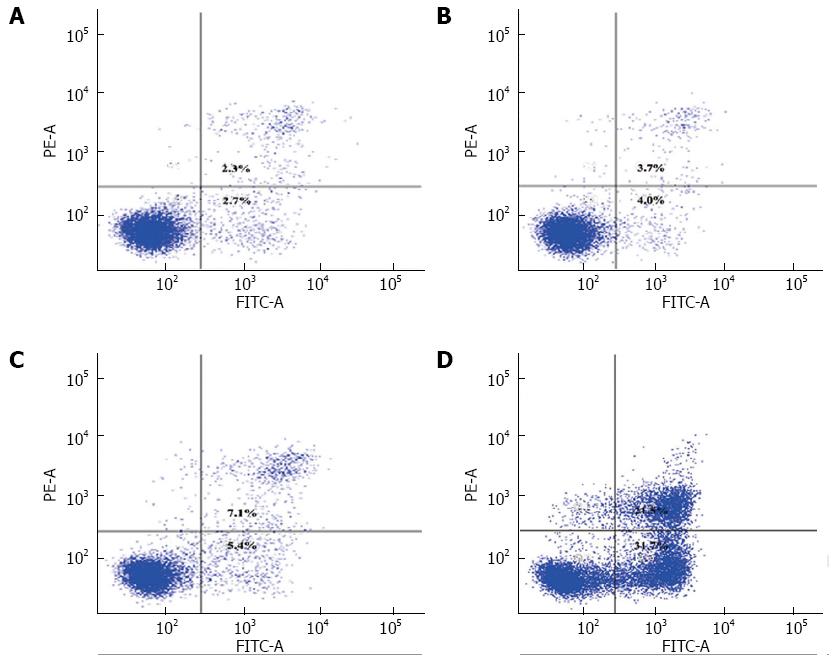
Figure 5 Apoptosis and necrosis were observed in SW1990 cells treated by CdSe/ZnS quantum dots with illumination.
A: normal SW1990 cells; B: SW1990 cells with illumination (20 J/cm2); C: SW1990 cells treated with CdSe/ZnS QDs (1.5 μmol/L, 3 h); D: SW1990 cells treated with CdSe/ZnS QDs (1.5 μmol/L, 3 h) and illumination (20 J/cm2). FCM of SW1990 cells showed that SW1990 cells had a higher apoptosis rate (53.2%) in Group D than in Groups A, B and C. QDs: Quantum dots.
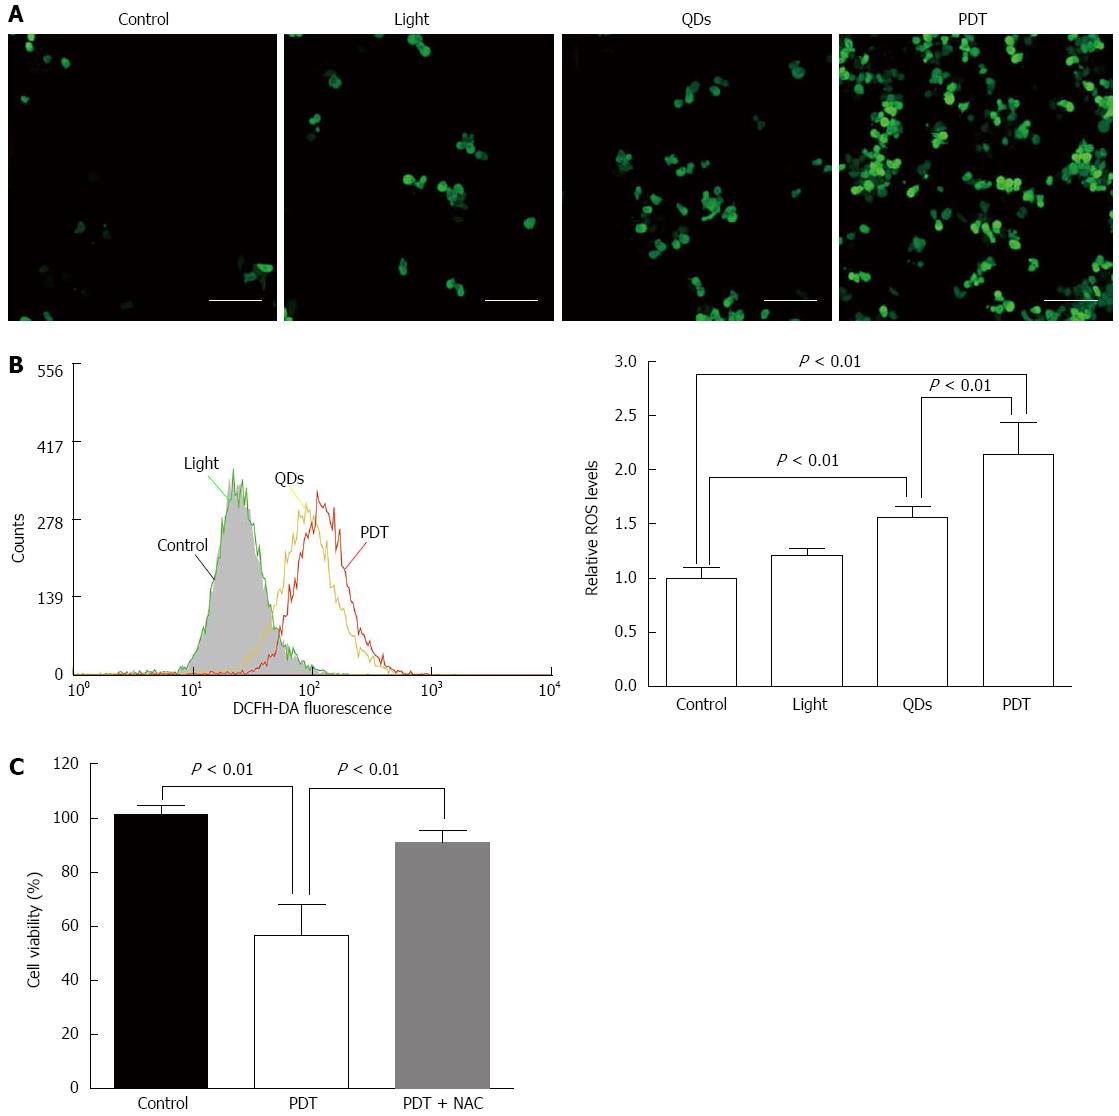
Figure 6 Reactive oxygen species generation was detected after treatment of CdSe/ZnS quantum dots with illumination.
A: Fluorescent images of ROS in SW1990 cells (Bar: 200 μm); B: Relative ROS level measured by FCM; C: Cell viability of SW1990 cells by CCK-8 assay. Control: normal SW1990 cells; Light: SW1990 cells with illumination (20 J/cm2); QDs: SW1990 cells treated with CdSe/ZnS QDs (1.5 μmol/L, 3 h); PDT: SW1990 cells treated with CdSe/ZnS QDs (1.5 μmol/L, 3 h) and illumination (20 J/cm2). NAC: N-acetylcysteine, a ROS scavenger, 5 mmol/L NAC was added to the cell culture for 1 h before treatment. QDs: Quantum dots; ROS: Reactive oxygen species.
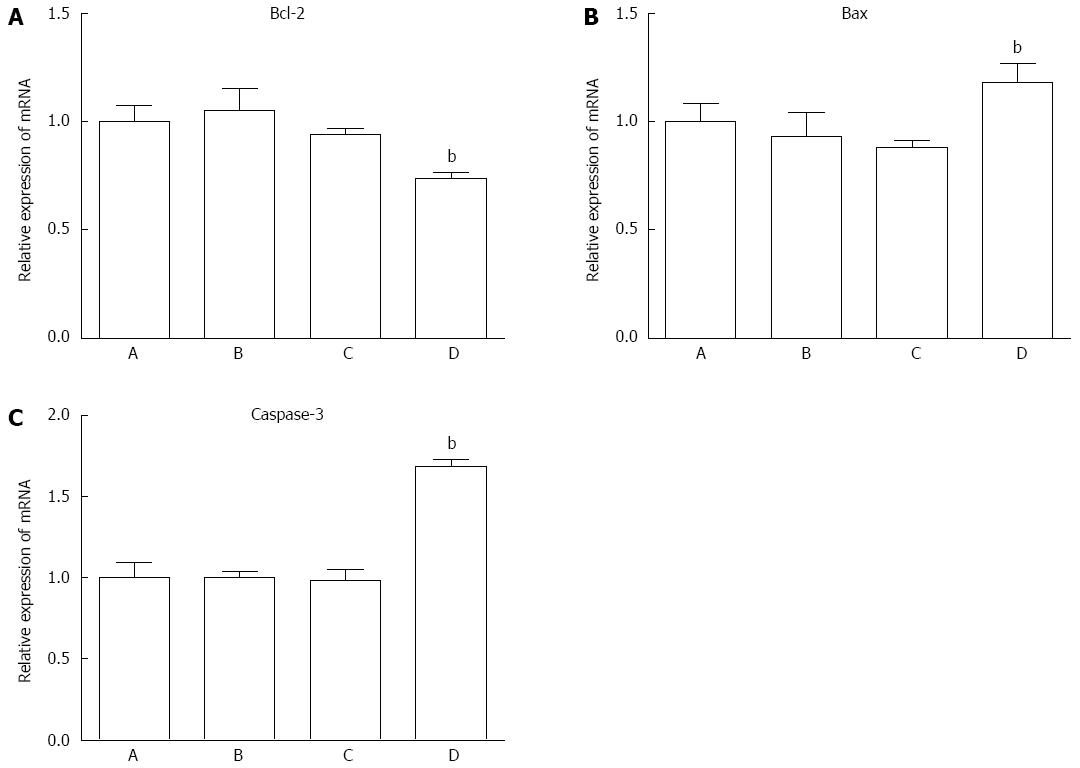
Figure 7 Changes in mRNA expression levels of Bax, Bcl-2 and caspase-3 following CdSe/ZnS quantum dots with illumination.
A: Normal SW1990 cells; B: SW1990 cells with illumination (20 J/cm2); C: SW1990 cells treated with CdSe/ZnS QDs (1.5 μmol/L, 3 h); D: SW1990 cells treated with CdSe/ZnS QDs (1.5 μmol/L, 3 h) and illumination (20 J/cm2). bP < 0.01 vs group A. QDs: Quantum dots.
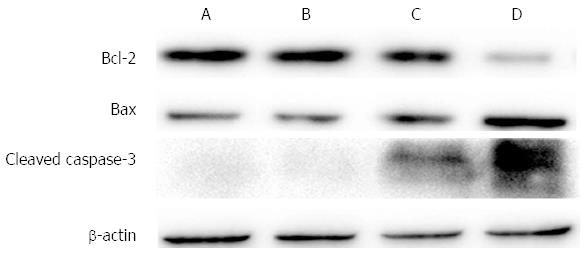
Figure 8 Changes in protein expression levels of Bax, Bcl-2 and caspase-3 following CdSe/ZnS quantum dots with illumination.
A: Normal SW1990 cells; B: SW1990 cells with illumination (20 J/cm2); C: SW1990 cells treated with CdSe/ZnS QDs (1.5 μmol/L, 3 h); D: SW1990 cells treated with CdSe/ZnS QDs (1.5 μmol/L, 3 h) and illumination (20J/cm2). QDs: Quantum dots.
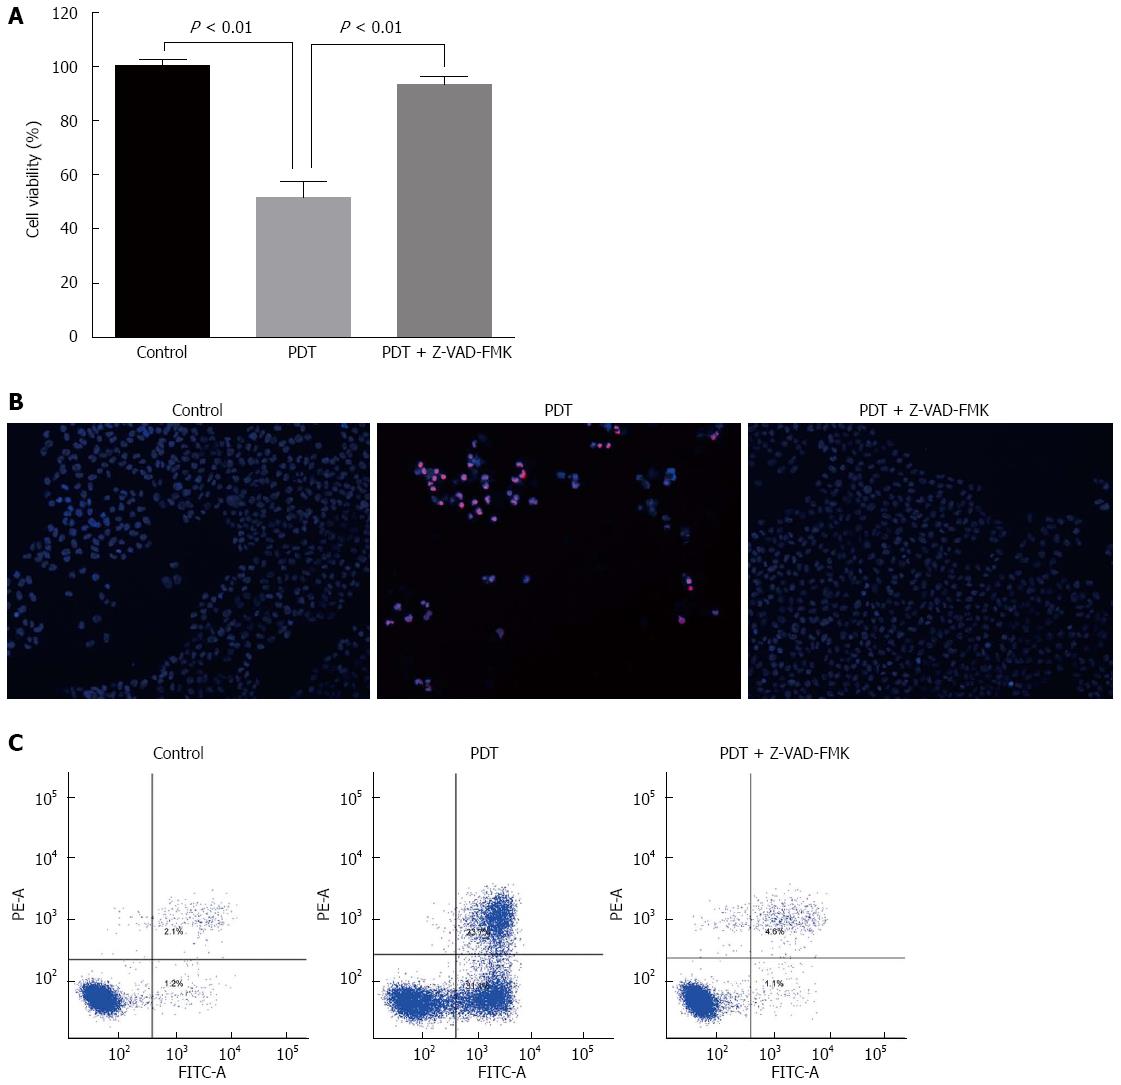
Figure 9 Quantum dots-photodynamic therapy-induced cell death via apoptosis.
A: Cell viability of SW1990 cells by CCK-8 assay; B: Hochest 33342/PI nucleus staining of apoptotic and necrotic SW1990 cells (magnification × 100), white arrow indicates dead cells; C: Percentage of apoptotic and necrotic SW1990 cells by FCM. SW1990 cells were pretreated with or without Z-VAD-FMK (50 μmol/L) for 1 h and then treated with QD-PDT (1.5 μmol/L, 3 h, 20 J/cm2). QDs: Quantum dots; PDT: Photodynamic therapy; FCM: Flow cytometry; CCK-8: Cell Counting Kit-8; PI: Propidium iodide.
- Citation: He SJ, Cao J, Li YS, Yang JC, Zhou M, Qu CY, Zhang Y, Shen F, Chen Y, Li MM, Xu LM. CdSe/ZnS quantum dots induce photodynamic effects and cytotoxicity in pancreatic cancer cells. World J Gastroenterol 2016; 22(21): 5012-5022
- URL: https://www.wjgnet.com/1007-9327/full/v22/i21/5012.htm
- DOI: https://dx.doi.org/10.3748/wjg.v22.i21.5012


