Copyright
©The Author(s) 2016.
World J Gastroenterol. Jun 7, 2016; 22(21): 4988-4998
Published online Jun 7, 2016. doi: 10.3748/wjg.v22.i21.4988
Published online Jun 7, 2016. doi: 10.3748/wjg.v22.i21.4988
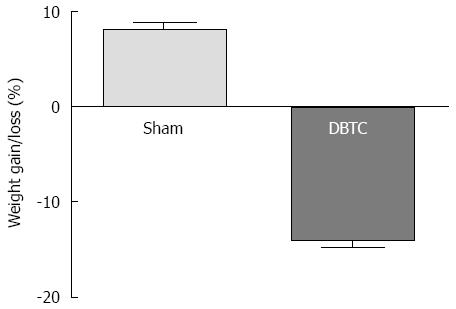
Figure 1 Percent weight gain in sham-treated controls (Sham) vs weight loss in dibutyltin dichloride-treated animals.
n = 8 animals/group (P < 0.001). DBTC: Dibutyltin dichloride.
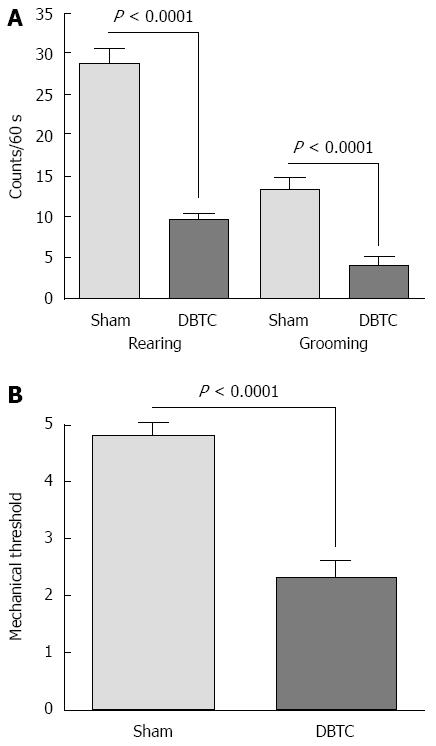
Figure 2 Rearing and grooming rate changes and hindpaw mechanical threshold modification due to dibutyltin dichloride-treatments.
A: Rearing and grooming rates significantly diminished in dibutyltin dichloride (DBTC)-treated animals vs the sham-administered animals and persisted throughout the study (P < 0.0001); B: Hindpaw withdrawal threshold response to mechanical stimuli in DBTC-treated animals (DBTC) had significant decreased vs sham-administered control (sham) mice (P < 0.0001). n = 5 animals/group.
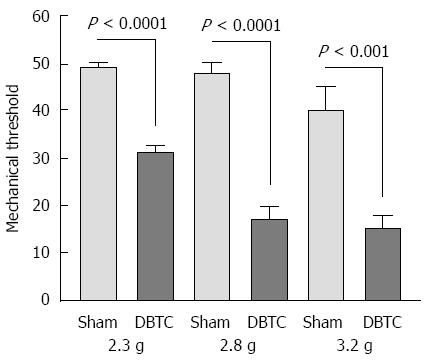
Figure 3 Abdominal threshold sensitivity to mechanical stimuli was determined with different gram forces of von Frey microfilaments as demonstrated here to 2.
3 g (P < 0.001), 2.8 g (P < 0.0001), 3.2 g (P < 0.001), in dibutyltin dichloride-treated vs sham-treated controls (sham). Data is presented as the 50% mechanical threshold response. n = 5 animals/group.
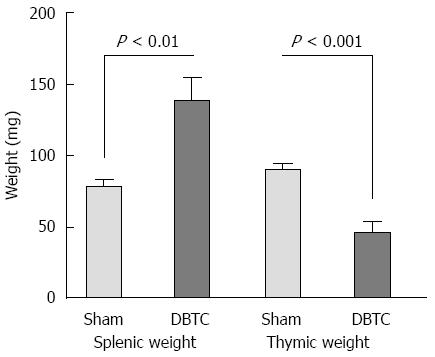
Figure 4 Splenic weight as well as splenic length (not shown) significantly increased in dibutyltin dichloride-treated animals (P < 0.
01). In contrast thymic weight decreased in dibutyltin dichloride-treated (DBTC) vs the sham-treated (sham) animals (P < 0.001) due to atrophy and depletion of lymphocytes and thymocytes. n = 8 animals/group.
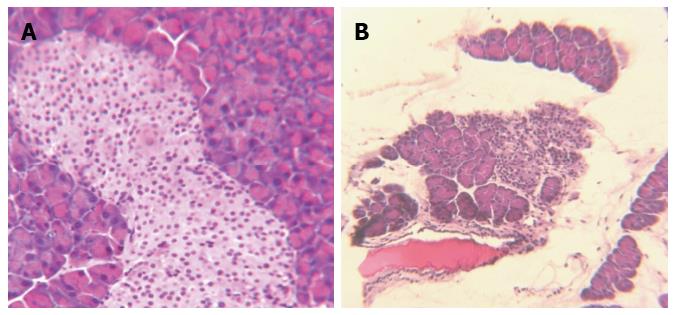
Figure 5 Pancreatic photomicrographs from sham-treated normal control (A) compared to dibutyltin dichloride-treated animal (B).
A: Pancreas: Photomicrograph demonstrates sham-treated control pancreas with normal pancreatic microstructure and islet cells. Representative slide from n = 8 animals/group; B: Pancreatitis: Photomicrograph illustrates pancreas from a dibutyltin dichloride-treated animal with significant loss of pancreatic structure and islets, acinar atrophy, infiltration of inflammatory cells, fatty deposits and edema (magnification × 40). Representative slide from n = 8 animals/group.
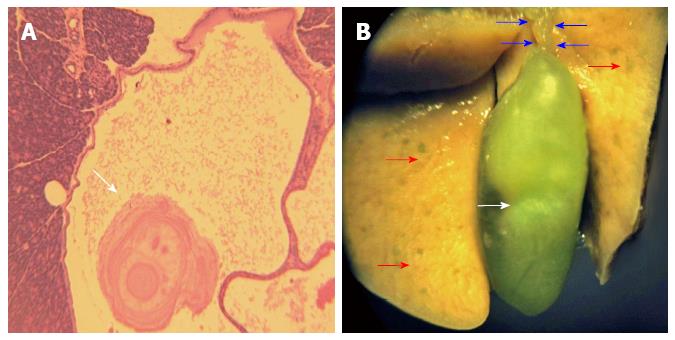
Figure 6 Photomicrograph from pancreatic ductal calculi formation (A), as well as hepatic and gall bladder gross pathological structure (B) in dibutyltin dichloride-treated animals.
A: Calculi formation: Photomicrograph illustrates histopathologic structure from a representative pancreas of a dibutyltin dichloride-treated animal to demonstrate ductal distension and calculi formation. Representative slide from n = 8 animals/group (magnification × 40); B: Photograph illustrates hepatic gross lesions (red arrows), expanded bile duct (blue arrows) and gall bladder (white arrow) from DBTC-treated animal. Representative from n = 8 animals/group.
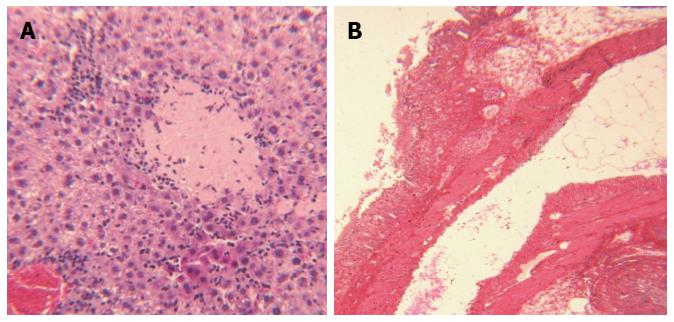
Figure 7 Photomicrograph of hepatitis (A) and colitis (B) from dibutyltin dichloride-treated animals.
A: Hepatitis: Photomicrograph illustrates necrosis of hepatocytes, infiltration of inflammatory cells (magnification × 40). Representative slide from n = 8 animals/group; B: Colitis: Photomicrograph demonstrates distortion of colonic microstructure, loss of brush boarder epithelial cells, infiltration of inflammatory cells into mucosa and cryptic abscess formation. Representative slide from n = 8 animals/group.
- Citation: Oz HS. Multiorgan chronic inflammatory hepatobiliary pancreatic murine model deficient in tumor necrosis factor receptors 1 and 2. World J Gastroenterol 2016; 22(21): 4988-4998
- URL: https://www.wjgnet.com/1007-9327/full/v22/i21/4988.htm
- DOI: https://dx.doi.org/10.3748/wjg.v22.i21.4988


