Copyright
©The Author(s) 2015.
World J Gastroenterol. Feb 21, 2015; 21(7): 2058-2066
Published online Feb 21, 2015. doi: 10.3748/wjg.v21.i7.2058
Published online Feb 21, 2015. doi: 10.3748/wjg.v21.i7.2058
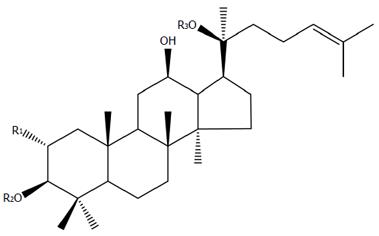
Figure 1 General structure of dammarane-type gypenosides consisting of both the hydrophobic sapogenin part and the hydrophilic sugar part in the molecule (where R1 and R2 = glucose, rhamnose; R3 = glucose, xylose).
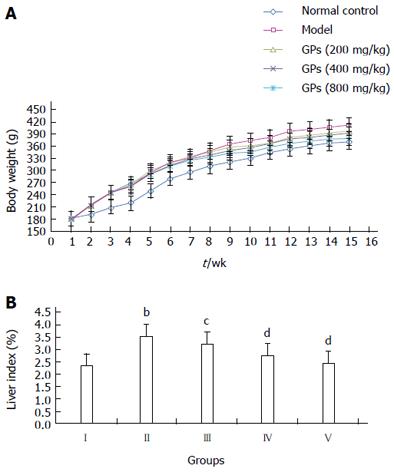
Figure 2 Effects of gypenosides on body weight (A) and liver index (B).
bP < 0.01 vs group I; cP < 0.05, dP < 0.01 vs group II.
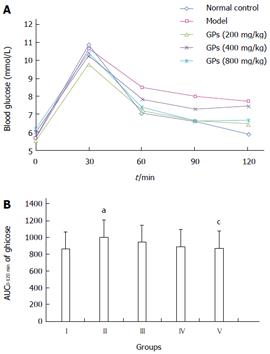
Figure 3 Effects of gypenosides on blood lipid and glucose levels.
A: Oral glucose tolerance: the blood glucose levels were measured before the glucose challenge; B: The area under the curve (AUC 0-120 min) after 30, 60, 90 or 120 min challenge was calculated and analyzed. (I) normal control, (II) model, (III) gypenosides (GPs) (200 mg/kg) + HFSD, (IV) GPs (400 mg/kg) + HFSD, (V) GPs (800 mg/kg) + HFSD. The values are expressed as mean ± SD in each group. aP < 0.05 vs normal control, cP < 0.05 vs model; n = 12.
Figure 4 Appearance of the liver (A) and histopathological examination using hematoxylin and eosin staining (B) (HE, × 200 magnification).
(I) normal control, (II) model, (III) gypenosides (GPs) (200 mg/kg) + HFSD, (IV) GPs (400 mg/kg) + HFSD, (V) GPs (800 mg/kg) + HFSD. HFSD: High fat and sugar diet.
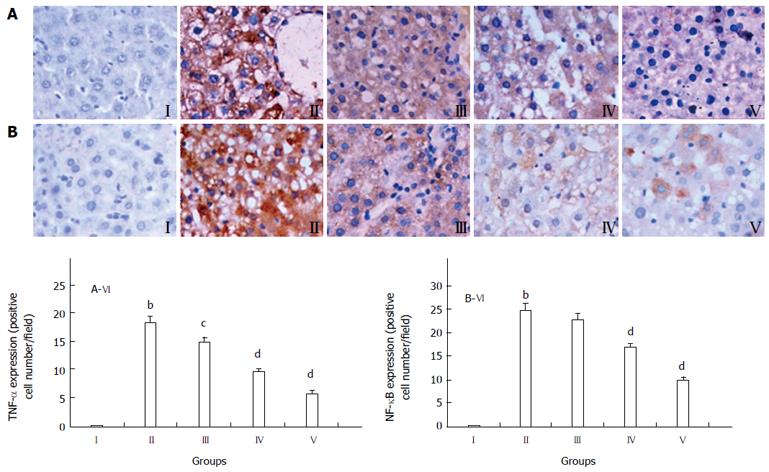
Figure 5 Representative photographs of immunohistochemical examination (× 400 magnification).
A: TNF-α; B: NF-κB. (I) normal control, (II) model, (III) gypenosides (GPs) (200 mg/kg) + HFSD, (IV) GPs (400 mg/kg) + HFSD, (V) GPs (800 mg/kg) + HFSD, (VI) Quantification of TNF-α and NF-κB stained cells. Data are expressed as mean ± SD of 12 rats. bP < 0.01 vs normal control; cP < 0.05, dP < 0.01 vs model.
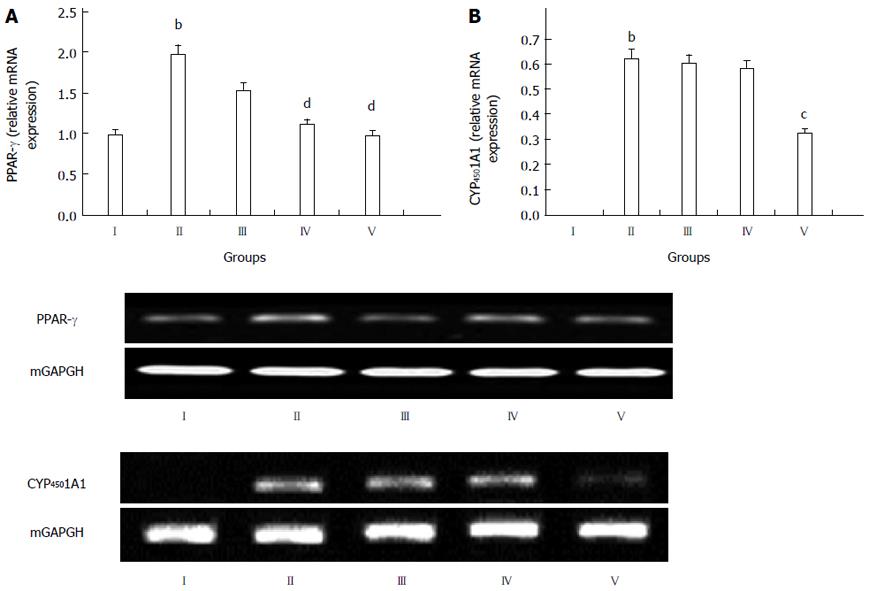
Figure 6 Effects of gypenosides on the gene expression in the liver tissue of high fat and sugar feed treated rats.
A: Rabbit anti-proliferator activated receptory (PPARγ); B: Rabbit anti-cytochrome P4501A1 (CYP1A1). (I) normal control, (II) model, (III) gypenosides (GPs) (200 mg/kg) + HFSD, (IV) GPs (400 mg/kg) + HFSD, (V) GPs (800 mg/kg) + HFSD. The values are expressed as mean ± SD in each group. bP < 0.01 vs normal control; cP < 0.05, dP < 0.01 vs model, n = 12.
- Citation: He Q, Li JK, Li F, Li RG, Zhan GQ, Li G, Du WX, Tan HB. Mechanism of action of gypenosides on type 2 diabetes and non-alcoholic fatty liver disease in rats. World J Gastroenterol 2015; 21(7): 2058-2066
- URL: https://www.wjgnet.com/1007-9327/full/v21/i7/2058.htm
- DOI: https://dx.doi.org/10.3748/wjg.v21.i7.2058


