Copyright
©The Author(s) 2015.
World J Gastroenterol. Feb 21, 2015; 21(7): 2047-2057
Published online Feb 21, 2015. doi: 10.3748/wjg.v21.i7.2047
Published online Feb 21, 2015. doi: 10.3748/wjg.v21.i7.2047
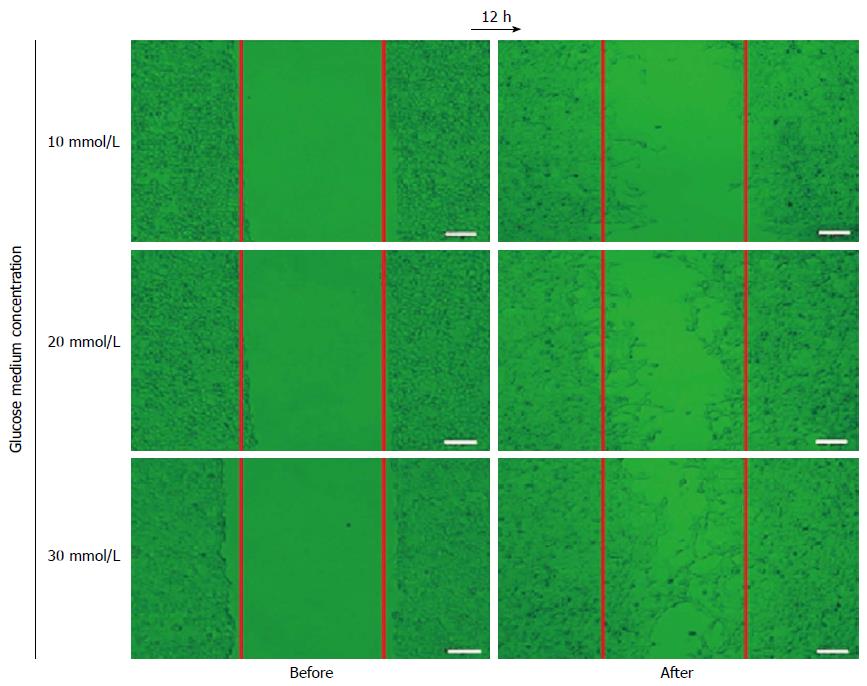
Figure 1 Effect of glucose on migration of CT-26 cells.
CT-26 cells were incubated with various concentrations of glucose (as indicated) for 12 h. The number of CT-26 cells that moved to the cell-free gap dose-dependently increased. Bar = 50 μm, n = 6 per group.
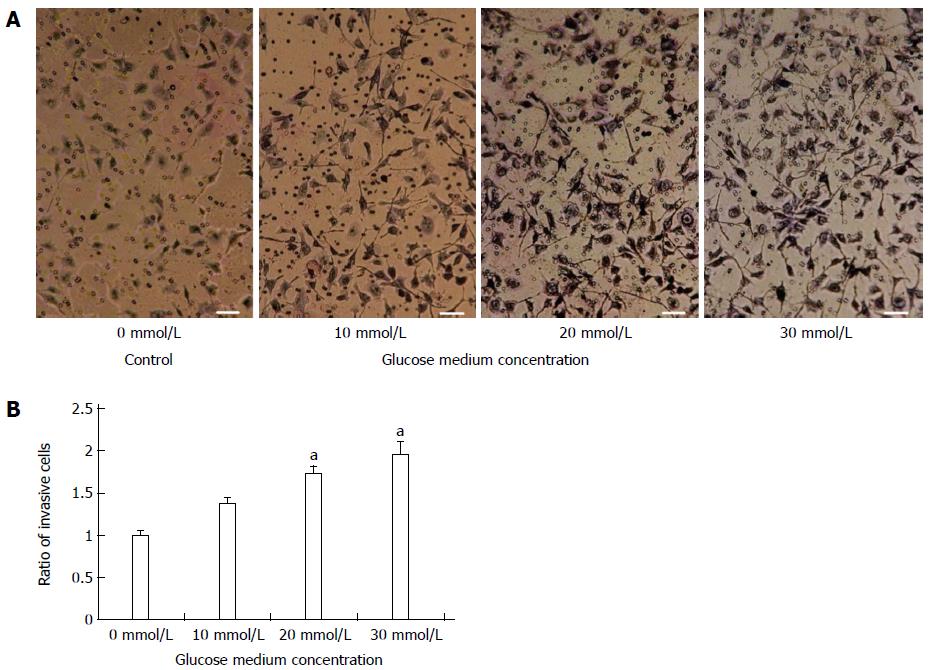
Figure 2 Effect of glucose on invasion of CT-26 cells.
A: The number of CT-26 cells that penetrated the basement membrane dose-dependently increased; B: About twice as many CT-26 cells in the 30 mmol/L group as in 0 mmol/L group penetrated the basement membrane (aP < 0.05 vs the control group). Bar = 100 μm, n = 6 per group.
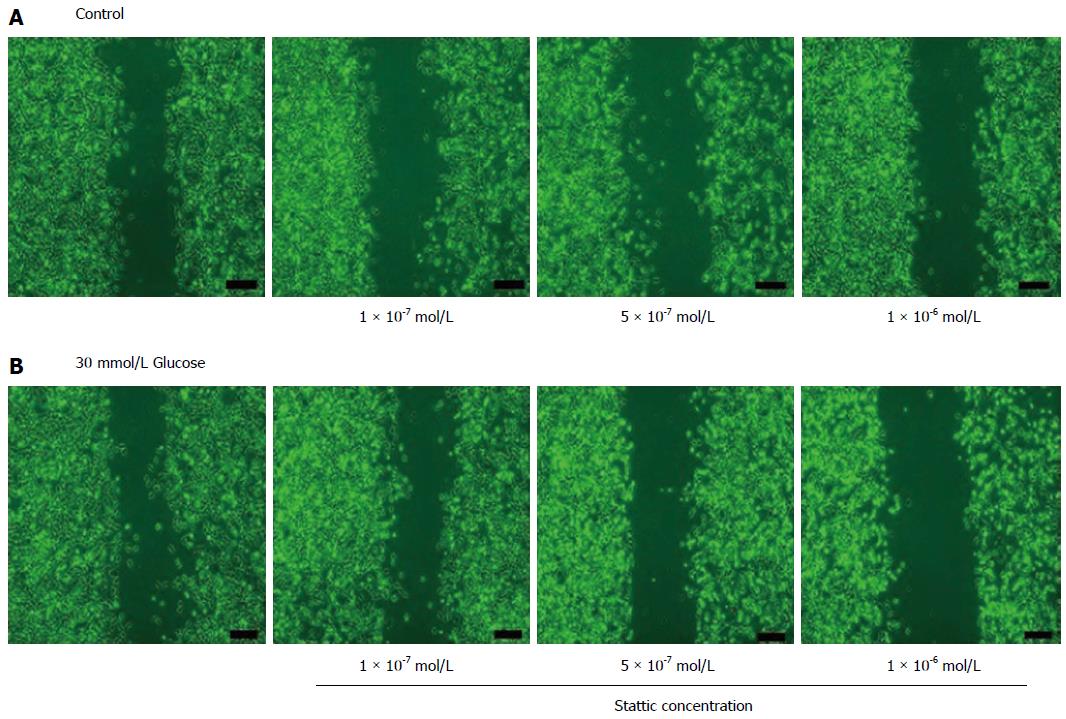
Figure 3 Effect of Stattic on CT-26 cell migration.
A: Control group; B: 30 mmol/L glucose-cultured group. In the glucose-free control group, Stattic had no noticeable effect on CT-26 cell motility. However, in the 30 mmol/L glucose group, the motility was noticeably dose-dependently lower. Bar = 200 μm, n = 6 per group.
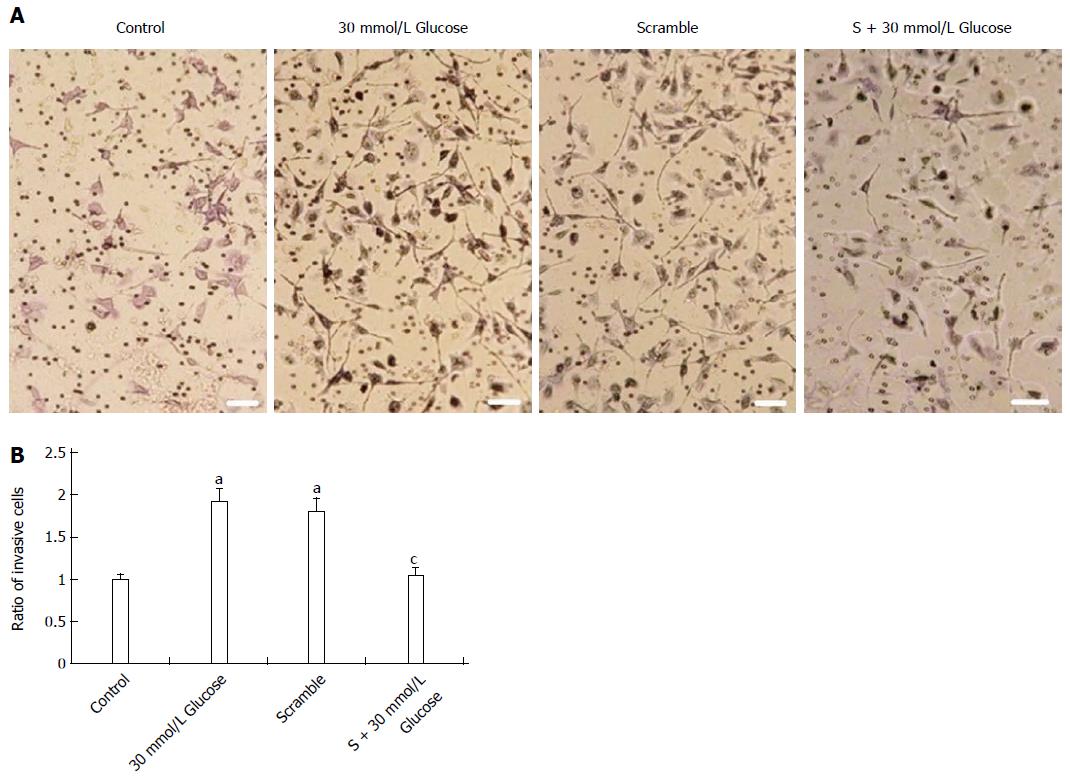
Figure 4 Effect of Stattic on the invasion of CT-26 cells.
A: In the 30 mmol/L glucose group (center), more CT-26 cells invaded than in the glucose-free control group (left). After Stattic had been added, the invasion of CT-26 cells was markedly lower (right); B: The invasion of CT-26 cells was obviously blocked after Stattic had been added. aP < 0.05 vs the control group; cP < 0.05 vs the 30 mmol/L glucose group. Bar = 100 μm, n = 6 per group. Stattic: 1 × 10⁻⁶ mol/L.
Figure 5 Effect of short interfering RNA on CT-26 cell migration.
In the glucose-free control group (A), CT-26 cell migration was almost nonexistent. In the 30 mmol/L glucose group (B) and in the scramble group (C), CT-26 cells moved to the wound gap area and substantially shortened the distance. In the siRNA group, cell migration was noticeably inhibited (D). Bar = 200 μm, n = 6 per group. S: siRNA; 50 nmol/L.
Figure 6 Effect of short interfering RNA on CT-26 cell invasion.
In the glucose-free control group (A), CT-26 cell invasion was not significant (B). In both the 30 mmol/L glucose group and the scramble group, significantly more CT-26 cells invaded. In the siRNA group, the invasion was significantly inhibited. About twice as many cells in the 30 mmol/L group as in the glucose-free control group invaded; but fewer cells invaded for the siRNA group than for the control group. aP < 0.05 vs the control group; cP < 0.05 vs the 30 mmol/L glucose group. Bar = 100 μm, n = 6 per group. S: siRNA; 50 nmol/L.
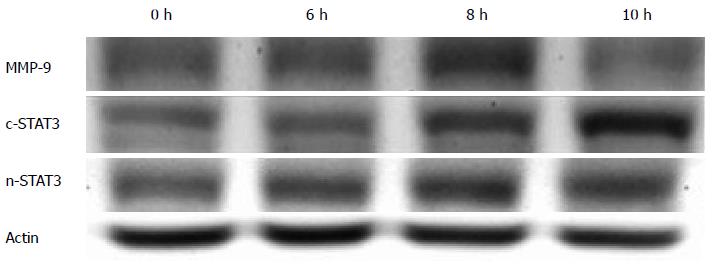
Figure 7 Matrix metalloproteinase-9 and signal transducer and activator of transcription 3 expression in the 30 mmol/L glucose group.
In the 30 mmol/L glucose group, matrix metalloproteinase-9 (MMP-9) and nuclear-signal transducer and activator of transcription 3 (STAT3) expression time-dependently increased and peaked at 8 h. Cytoplasmic STAT3 peaked at 10 h. n = 6 per group. c-STAT3: Cytoplasmic STAT3; n-STAT3: Nuclear STAT3.
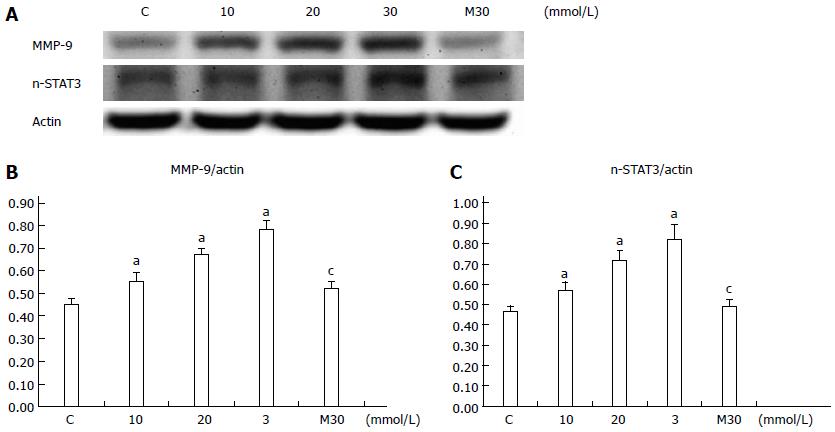
Figure 8 Effect of glucose on matrix metalloproteinase-9 and signal transducer and activator of transcription 3 expression.
The expression of both matrix metalloproteinase-9 (MMP-9) (A, B) and n-signal transducer and activator of transcription 3 (STAT3) (A, C) proteins were dose-dependently and significantly higher than in the C (control) group. In the M30 group (treated with 30 mmol/L of mannitol), neither MMP-9 nor n-STAT3 expression was significantly higher than in the C (control) group. aP < 0.05 vs the control group; cP > 0.05 vs the control group. n = 6 per group. C: Control; 0 mmol/L; M30: Mannitol; 30 mmol/L.
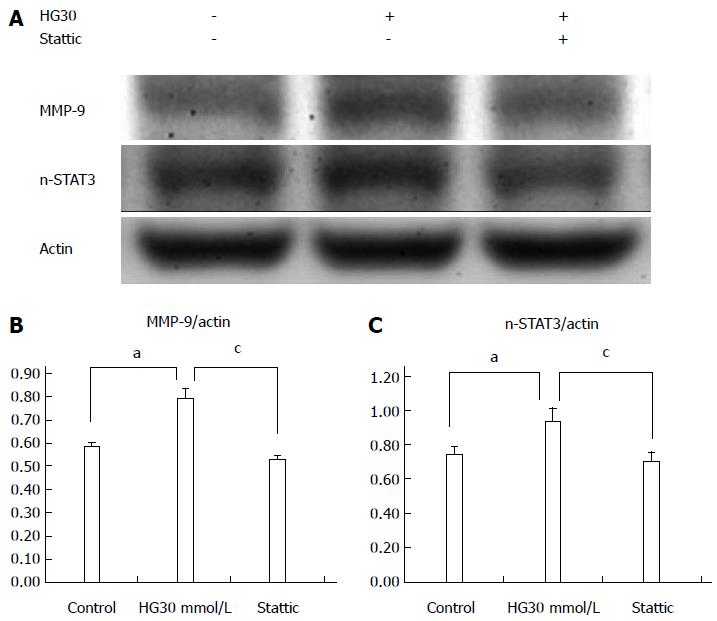
Figure 9 Effect of Stattic on matrix metalloproteinase-9 and signal transducer and activator of transcription 3 expression.
In the HG30 group, the expression of both matrix metalloproteinase-9 (MMP-9) (A, B) and n-signal transducer and activator of transcription 3 (STAT3) (A, C) proteins were higher than in the C (control) group. When Stattic was added, the MMP-9/actin (B) and n-STAT3/actin (C) were significantly decreased. aP < 0.05 vs the control group; cP < 0.05 vs the 30 mmol/L glucose group. n = 6 per group. HG30: Glucose 30 mmol/L; Stattic: 1 × 10⁻⁶ mol/L.
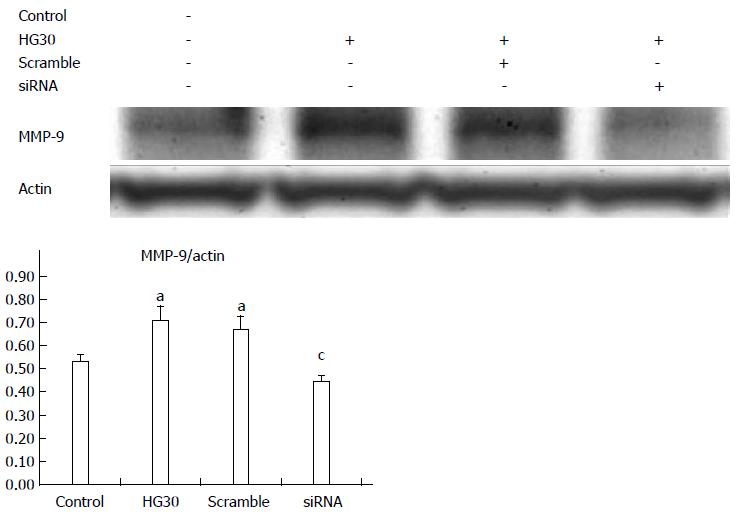
Figure 10 Effect of siRNA on matrix metalloproteinase-9 expression.
In the HG30 group, matrix metalloproteinase-9 (MMP-9) expression was significantly higher; in the scramble group, it was not affected; in the siRNA group, it was significantly inhibited. aP < 0.05 vs the control group; cP < 0.05 vs the 30 mmol/L glucose group. n = 6 per group. HG30: Glucose 30 mmol/L; siRNA: 50 mmol/L.
- Citation: Lin CY, Lee CH, Huang CC, Lee ST, Guo HR, Su SB. Impact of high glucose on metastasis of colon cancer cells. World J Gastroenterol 2015; 21(7): 2047-2057
- URL: https://www.wjgnet.com/1007-9327/full/v21/i7/2047.htm
- DOI: https://dx.doi.org/10.3748/wjg.v21.i7.2047


