Copyright
©The Author(s) 2015.
World J Gastroenterol. Feb 21, 2015; 21(7): 2011-2029
Published online Feb 21, 2015. doi: 10.3748/wjg.v21.i7.2011
Published online Feb 21, 2015. doi: 10.3748/wjg.v21.i7.2011
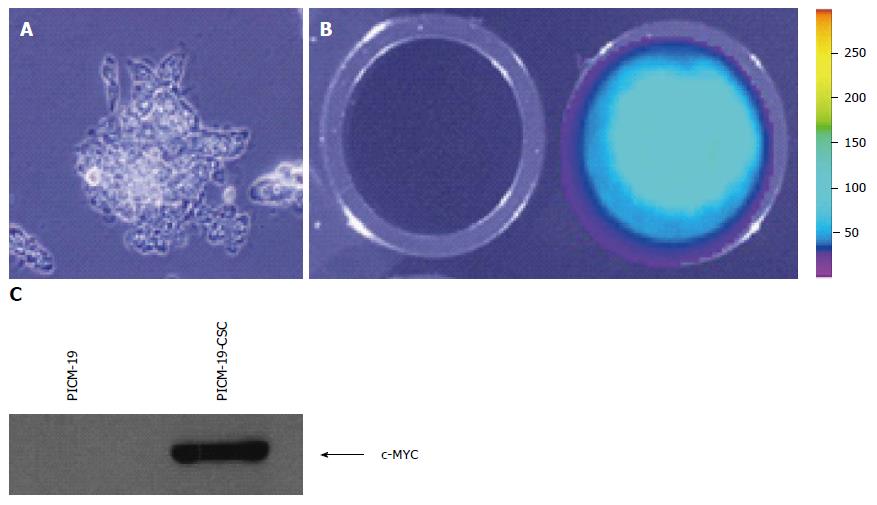
Figure 1 Generation of PICM-19-CSCs.
A: Feeder-independent PICM-19 cells were grown in 10% DMEM/Medium 199 on Matrigel in 24-well plates (see Materials and Methods). They were transfected with pUNO1-MYC-IRES-Luc plasmid and tested for luciferase expression using luciferin as substrate; B: Untransfected PICM-19 cells did not show bioluminescence (left panel), whereas transfected cells expressed luciferase (right panel); C: Detection of MYC protein in PICM-19-CSCs by Western blotting using the anti-human mouse c-MYC monoclonal antibody. As expected, PICM-19-CSCs, but not the untransfected PICM-19 stem cells (control) expressed MYC.
Figure 2 PICM-19-CSCs generate tumors after implantation in mice.
A: PICM-19 cells were transfected with 3 μg of pUNO1-hMYC by nucleofection. 1 x 10⁶ PICM-19 cells expressing MYC were implanted into the back flanks of NOD-SCID mice (n = 3) by subcutaneous injections. Tumors that grew to 1.5 cm in diameter were harvested; B and C: Tumors were sectioned and HE staining was performed, and cells were visualized by confocal microscopy (B: × 40; C: × 400). These images show that the PICM-19-CSCs induced tumors were uniform, and the cells were actively dividing in the PICM-19-CSC tumors, as seen by mitotic cell division [indicated by arrows in (C)].
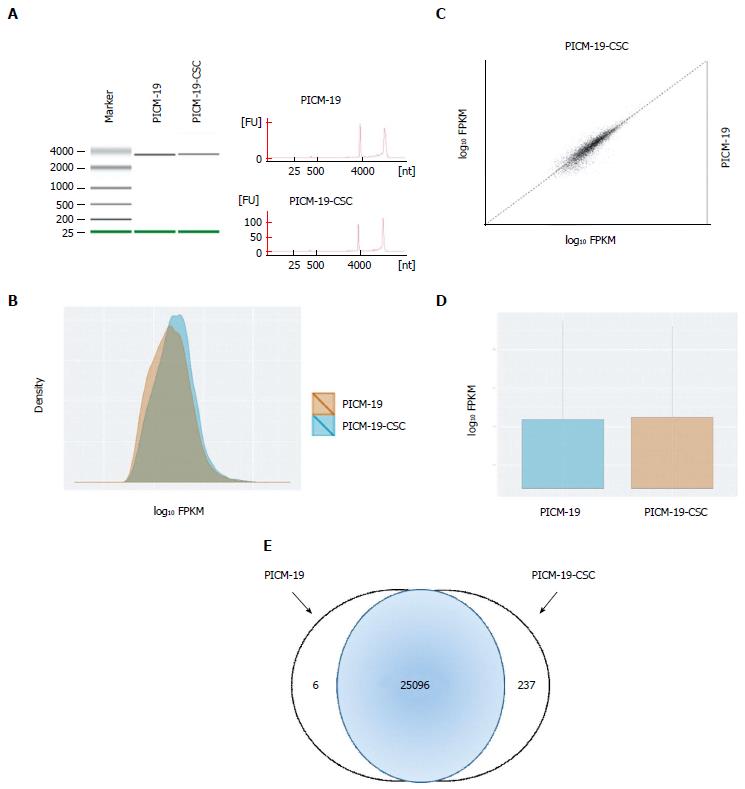
Figure 3 RNA sequencing of PICM-19 liver stem cells and PICM-19-CSCs.
A: Quality of the RNA extracted from PICM-19 and PICM-19-CSCs was assessed by electrophoresis (left panel) and by Nanodrop measurement to determine (RIN) for each cell type. RIN for PICM-19 and PICM-19-CSCs was 9.50 and 9.30, respectively. After the completion of sequencing, data was analyzed with TopHat and Cufflinks (see Materials and Methods), differential gene expression was calculated as fragments per kilobase of transcripts per million mapped reads (FPKM). Data thus obtained was plotted as a B: Density plot; C: Scatter Matrix plot; D: Box plot. Differentially expressed genes for each cell type were shown as log10 fold change. log10 fold change of 2 or greater was considered significant. In total, 25096 genes were differentially expressed in both cell types, whereas PICM-19 and PICM-19-CSCs displayed unique expression of 6 and 237 genes, respectively.
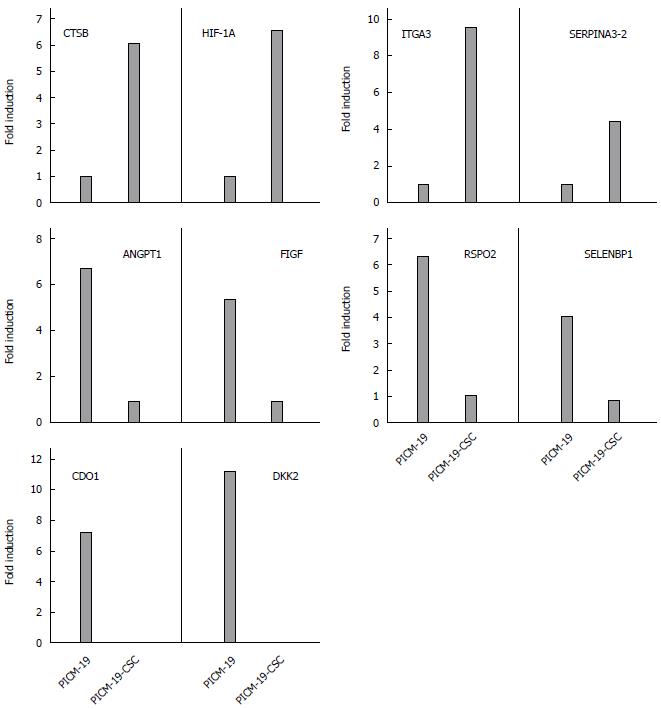
Figure 4 Validation of RNA-seq data using real-time polymerase chain reaction.
Expression of ten genes was tested by real-time polymerase chain reaction using total RNA isolated from PICM-19 and PICM-19-CSCs (see Materials and Methods). Data are presented as mean values from three independent experiments with a variance of < 10%.
- Citation: Aravalli RN, Talbot NC, Steer CJ. Gene expression profiling of MYC-driven tumor signatures in porcine liver stem cells by transcriptome sequencing. World J Gastroenterol 2015; 21(7): 2011-2029
- URL: https://www.wjgnet.com/1007-9327/full/v21/i7/2011.htm
- DOI: https://dx.doi.org/10.3748/wjg.v21.i7.2011


