Copyright
©The Author(s) 2015.
World J Gastroenterol. Feb 7, 2015; 21(5): 1636-1640
Published online Feb 7, 2015. doi: 10.3748/wjg.v21.i5.1636
Published online Feb 7, 2015. doi: 10.3748/wjg.v21.i5.1636
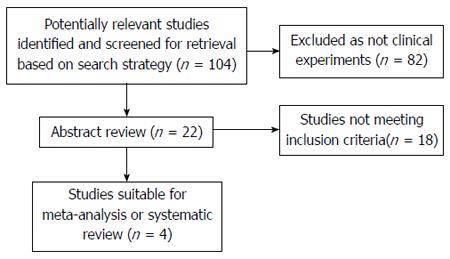
Figure 1 Study flow.
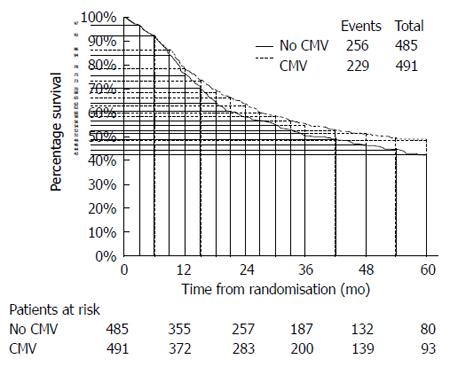
Figure 2 An example of how to extract the data from the Kaplan-Meier curves[10].
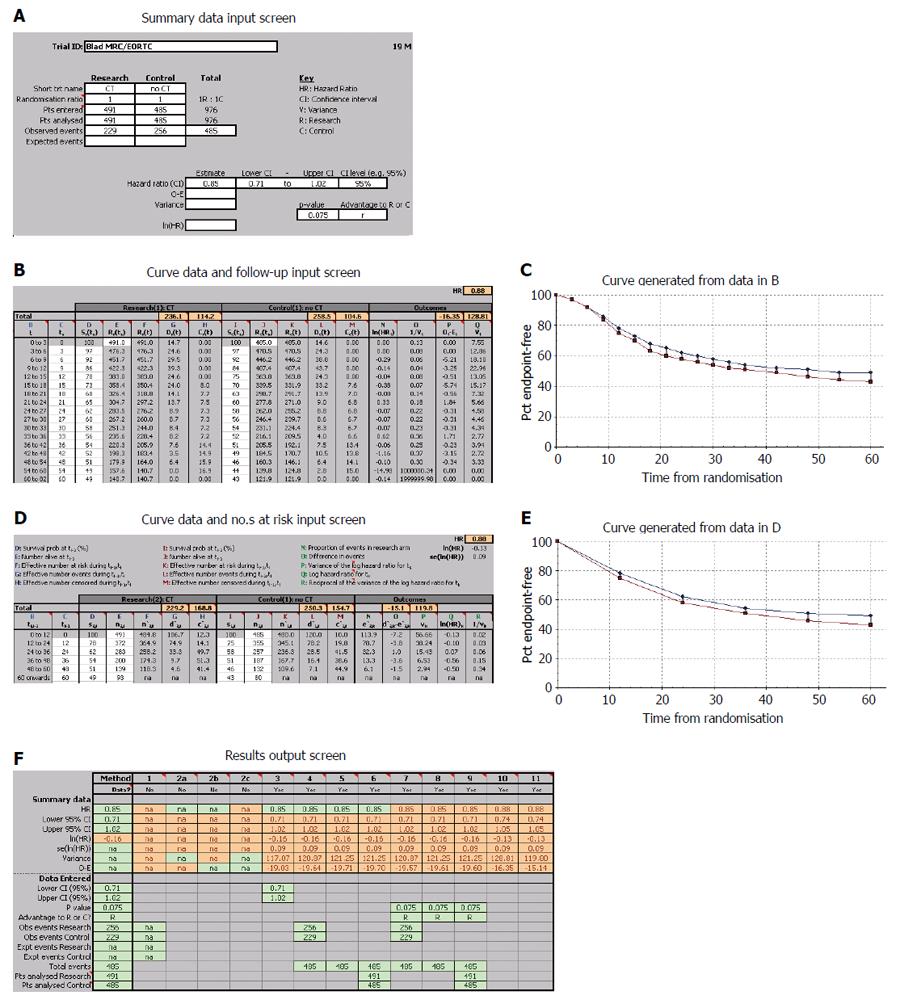
Figure 3 An example depicting the process by which the data extracted from the K-M curves are input into the HR calculation spreadsheet, step by step[10].
Data input screens (A, B and D), generated curves (C and E) and output screen (F) from the calculations spreadsheet.
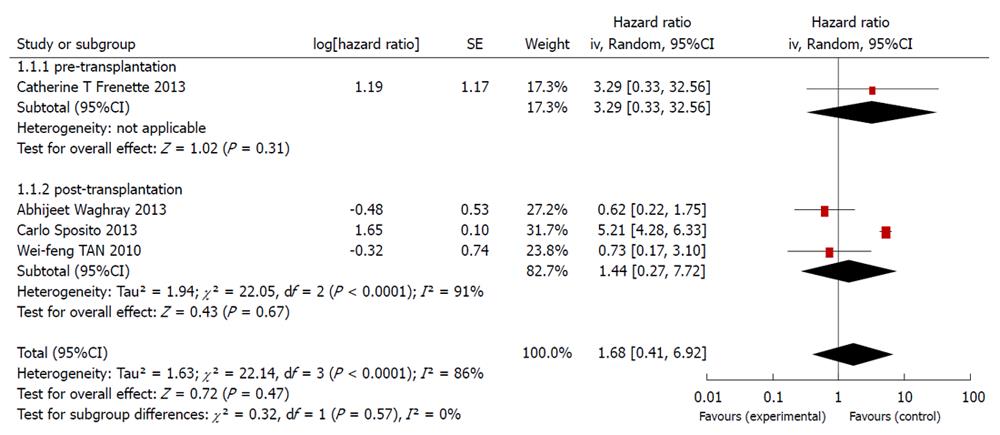
Figure 4 Meta-analysis of the cohort trials comparing the effects of sorafenib in improving survival time during liver transplantation.
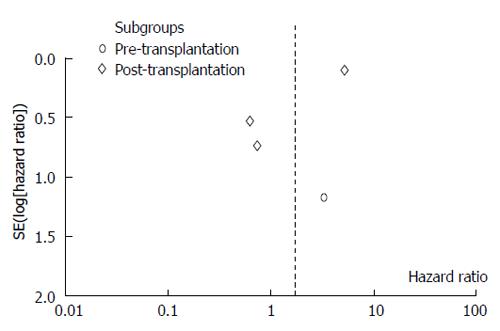
Figure 5 Funnel plot of the included studies.
- Citation: Qi HL, Zhuang BJ, Li CS, Liu QY. Peri-operative use of sorafenib in liver transplantation: A time-to-event meta-analysis. World J Gastroenterol 2015; 21(5): 1636-1640
- URL: https://www.wjgnet.com/1007-9327/full/v21/i5/1636.htm
- DOI: https://dx.doi.org/10.3748/wjg.v21.i5.1636


