Copyright
©The Author(s) 2015.
World J Gastroenterol. Dec 14, 2015; 21(46): 13030-13041
Published online Dec 14, 2015. doi: 10.3748/wjg.v21.i46.13030
Published online Dec 14, 2015. doi: 10.3748/wjg.v21.i46.13030
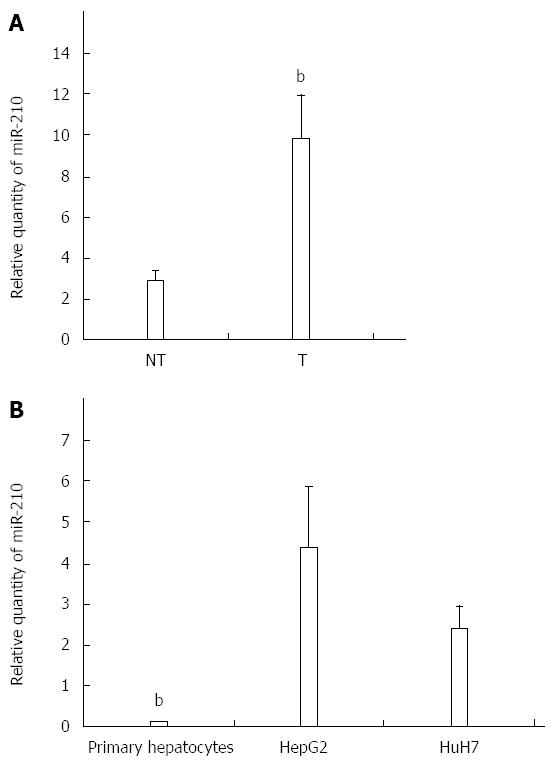
Figure 1 miR-210 expression is up-regulated in hepatocellular carcinoma.
Reverse transcription-real time PCR analysis of miR-210 in (A) hepatocellular carcinoma (HCC) tumor (T) and paired non-tumor (NT) samples and (B) primary hepatocytes, HepG2 cells and HuH7 cells. Data shown are expressed as mean ± SE for the HCC paired samples with bP < 0.01, Student’s paired t-test analysis for comparison between tumor and paired non-tumor samples; and mean ± SD for the primary hepatocytes and cell lines with bP < 0.01, Student’s t-test analysis for comparison between primary hepatocytes to either HepG2 or HuH7 cells.
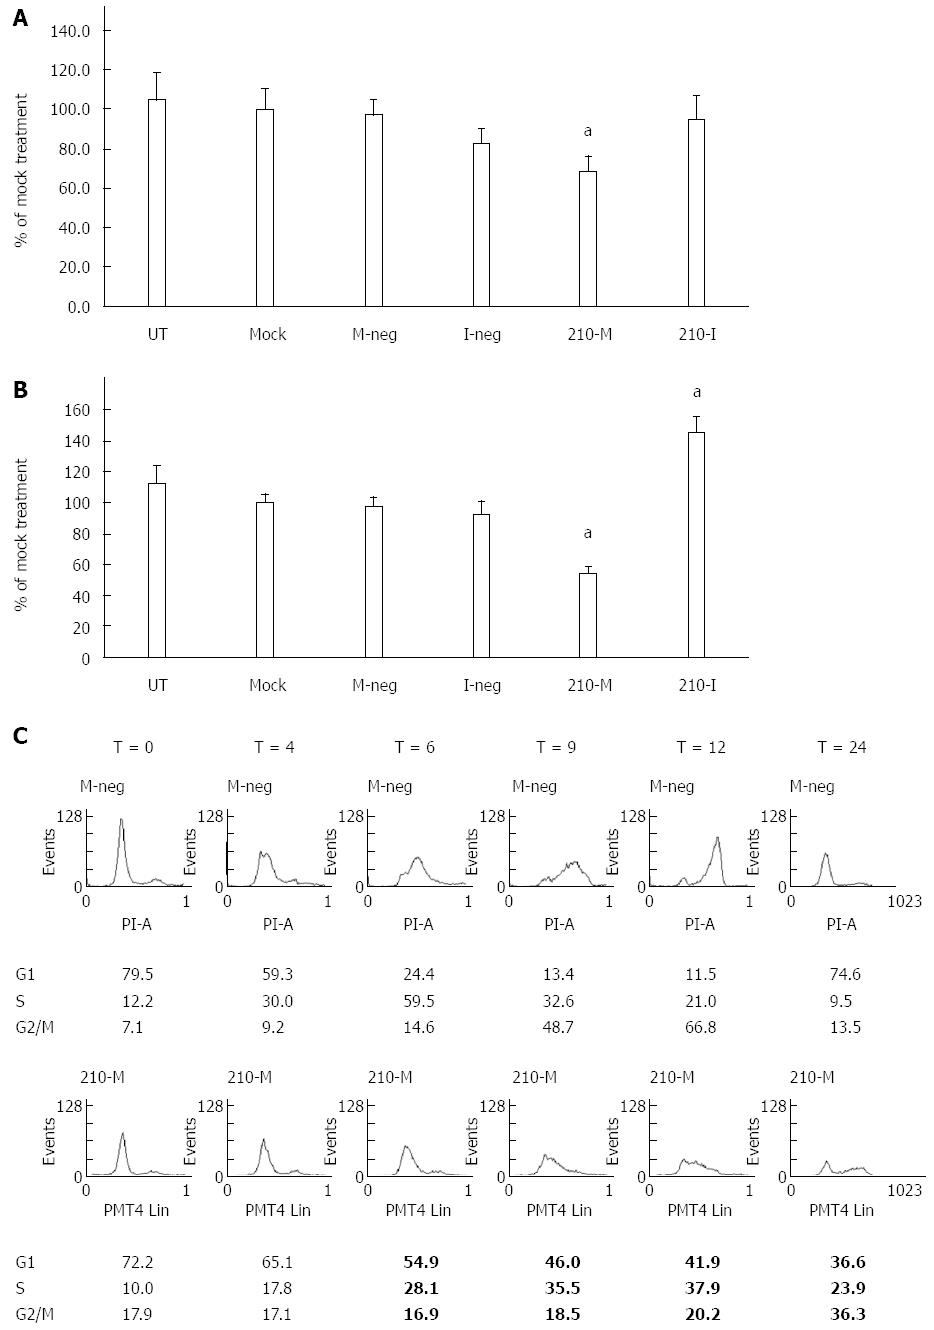
Figure 2 Effects of miR-210 on proliferation of hepatocellular carcinoma cells.
A and B: HepG2 cells (A) or HuH7 cells (B) were left untreated (UT), or mock transfected with Lipofectamine 2000 (Mock), or transfected with Mimic Negative Control (M-Neg), or Inhibitor Negative Control (I-Neg), or microRNA-210 Mimic (210-M), or microRNA-210 Inhibitor (210-I). Cell proliferation was determined using the MTS assay. Data shown are expressed as mean ± SD (n = 4). aP < 0.05, Student’s t-test analysis for comparison to the mock treatment; C: Flow cytometry analysis of HuH7 cells at various time points (T = 0 h - T = 24 h) following transfection with either M-neg or 210-M and synchronization of the cells. Percentage of total cell population in each phase is shown below each graph.
Figure 3 Genes targeted by miR-210 as predicted by miRBase/miRanda and selected for further analysis in this study.
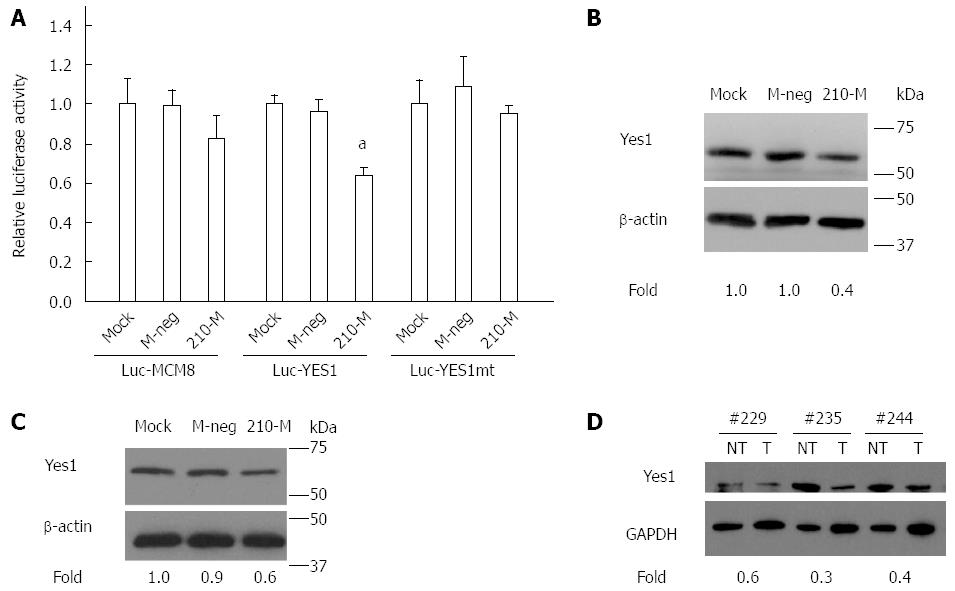
Figure 4 Regulation of Yes1 by miR-210.
A: Relative luciferase activity of HuH7 cells which were mock-transfected with Lipofectamine 2000 (Mock), or transfected with Mimic Negative Control (M-Neg), or microRNA-210 Mimic (210-M) followed by transfection with the Luc-MCM8 or Luc-Yes1 or Luc-Yes1mt reporter constructs and the pRL-CMV Renilla luciferase control plasmid. Data shown are expressed as mean ± SD. Assays were carried out in triplicate and as two independent experiments. aP < 0.05, Student’s t-test analysis for comparison to the corresponding control; B and C: Western blot analysis of Yes1 protein expression (top panel) in HuH7 cells (B) or HepG2 cells (C) treated with Mock, M-Neg, or 210-M. β-actin was used as the control for normalization (bottom panel). Yes1 expression was normalized to that of β-actin and the fold change was determined by comparison with the levels in Mock transfected cells; D: Western blot analysis of Yes1 expression (top panel) in HCC tumor (T) and paired non-tumor (NT) samples. GAPDH was used as the control for normalization (bottom panel). Yes1 expression was normalized to that of GAPDH and the fold change was determined by comparison with the paired non-tumor samples.
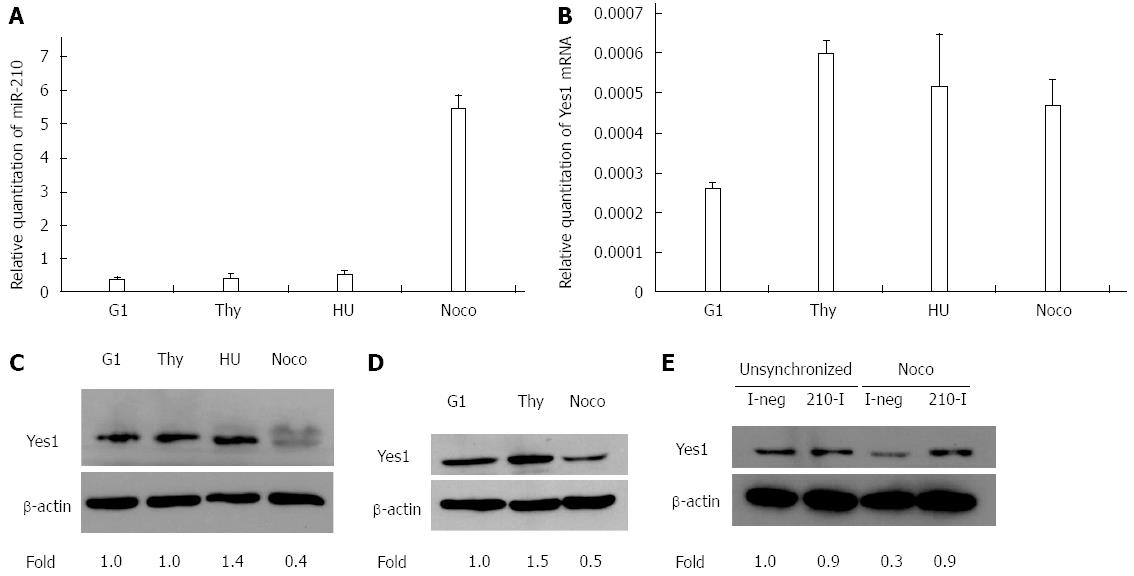
Figure 5 Expression of miR-210 and Yes1 in the different phases of the cell cycle.
A: Expression of miR-210 in HuH7 cells; B: Expression of Yes1 transcript in HuH7 cells; C and D: Western blot analysis of Yes1 protein expression (top panel) and in HuH7 cells (C) and HepG2 cells (D). Cells were enriched in the different cell cycle phases corresponding to G1 phase, S phase with thymidine double block treatment (Thy) or hydroxyurea treatment (HU), and G2/M phase with nocodazole treatment and mitotic shake-off (Noco); E: Western blot analysis of Yes1 protein expression (top panel) was performed with unsynchronized or nocodazole-treated (Noco) HuH7 cells following transfection with Inhibitor Negative Control (I-neg) or microRNA-210 Inhibitor (210-I). β-actin was used as the control for normalization (bottom panel). Yes1 expression was normalized to that of β-actin and the fold change was determined by comparison with the levels in G1-enriched cells (for C, D) or the unsynchronized cells transfected with I-neg (for E).
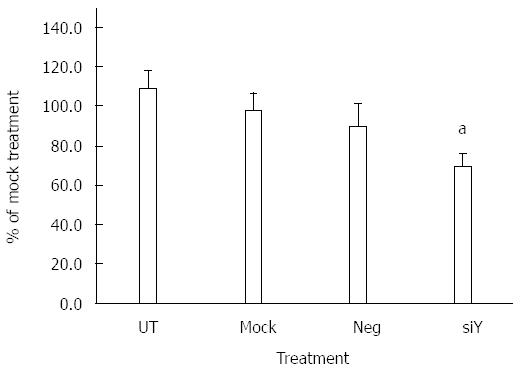
Figure 6 Silencing of Yes1 reduces proliferation of hepatocellular carcinoma cells.
HuH7 cells were untreated (UT), or mock transfected with Lipofectamine 2000 (Mock), or transfected with either siRNA negative control (Neg) or siRNA targeting Yes1 (siY). Cell proliferation was determined using the MTS assay. Data shown represent mean ± SD (n = 4). aP < 0.05, Student’s t-test analysis for comparison to mock treatment.
- Citation: Tan W, Lim SG, Tan TM. Up-regulation of microRNA-210 inhibits proliferation of hepatocellular carcinoma cells by targeting YES1. World J Gastroenterol 2015; 21(46): 13030-13041
- URL: https://www.wjgnet.com/1007-9327/full/v21/i46/13030.htm
- DOI: https://dx.doi.org/10.3748/wjg.v21.i46.13030


