Copyright
©The Author(s) 2015.
World J Gastroenterol. Oct 28, 2015; 21(40): 11481-11488
Published online Oct 28, 2015. doi: 10.3748/wjg.v21.i40.11481
Published online Oct 28, 2015. doi: 10.3748/wjg.v21.i40.11481
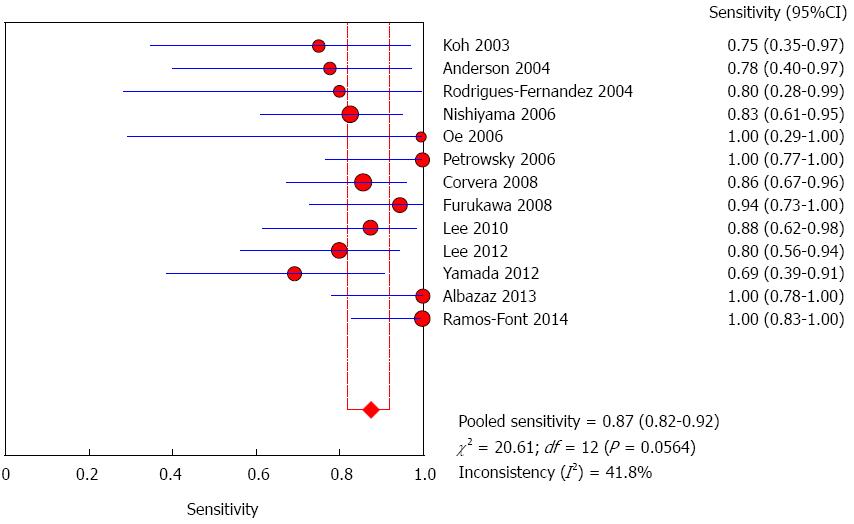
Figure 1 Sensitivity values of fluorine-18-fluorodeoxyglucose positron emission tomography and positron emission tomography/computed tomography in the studies (n = 13) included in the meta-analysis.
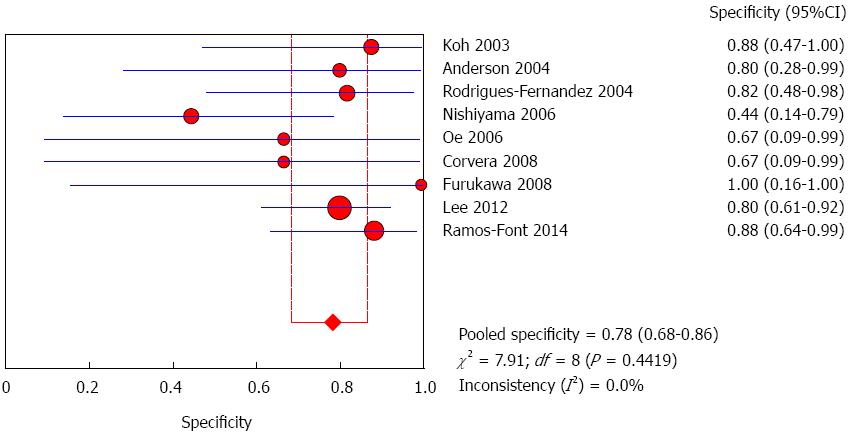
Figure 2 Specificity values of fluorine-18-fluorodeoxyglucose positron emission tomography and positron emission tomography/computed tomography in the studies (n = 9) included in the meta-analysis.
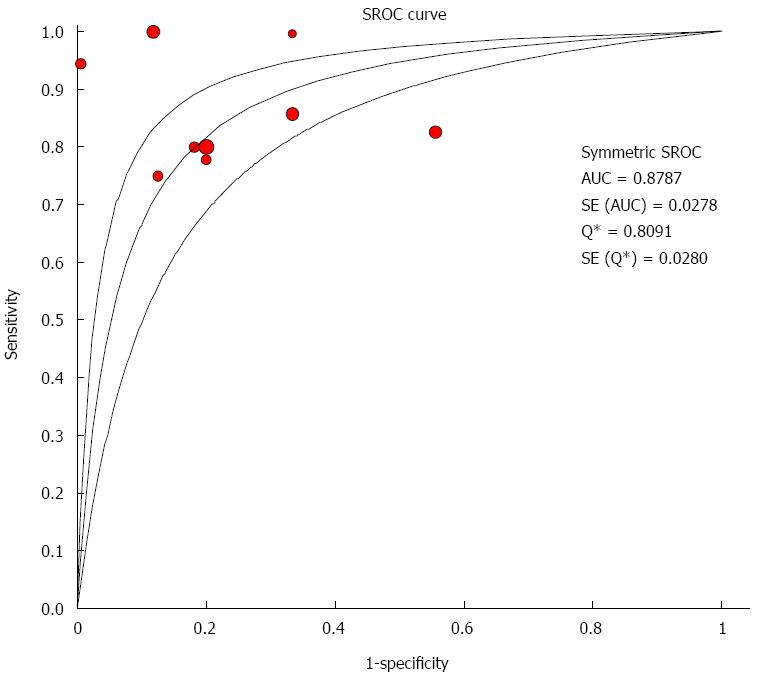
Figure 3 Receiving operator characteristics curve analysis of accuracy values of studies (n = 9) included in the meta-analysis.
- Citation: Annunziata S, Pizzuto DA, Caldarella C, Galiandro F, Sadeghi R, Treglia G. Diagnostic accuracy of fluorine-18-fluorodeoxyglucose positron emission tomography in gallbladder cancer: A meta-analysis. World J Gastroenterol 2015; 21(40): 11481-11488
- URL: https://www.wjgnet.com/1007-9327/full/v21/i40/11481.htm
- DOI: https://dx.doi.org/10.3748/wjg.v21.i40.11481


