Copyright
©The Author(s) 2015.
World J Gastroenterol. Jan 28, 2015; 21(4): 1299-1304
Published online Jan 28, 2015. doi: 10.3748/wjg.v21.i4.1299
Published online Jan 28, 2015. doi: 10.3748/wjg.v21.i4.1299
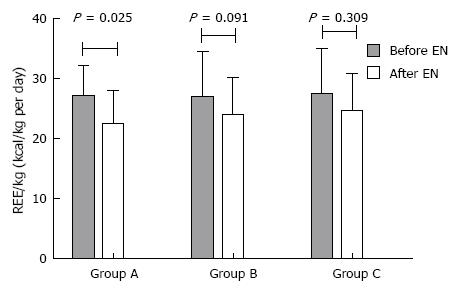
Figure 1 Difference of the measured resting energy expenditure before and after enteral nutrition support in each group.
Metabolism was measured by resting energy expenditure (REE) per kilogram. P-values were calculated by paired-samples t-test. EN: Enteral nutrition.
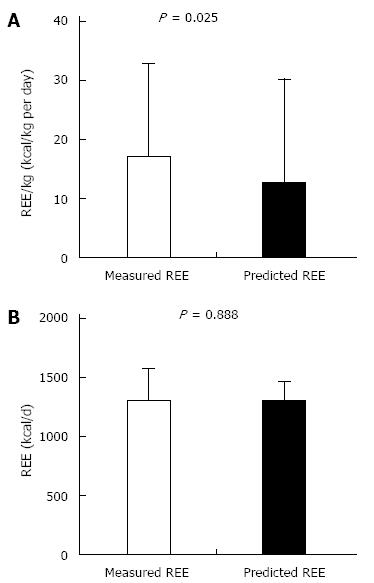
Figure 2 Measured resting energy expenditure vs predicted resting energy expenditure.
Measured resting energy expenditure (REE) vs predicted REE using 25 kcal/kg (A) and the Harris-Benedict (H-B) equation (B). The comparison was aimed at patients in the active phase before enteral nutrition support (group A + B). P-values were calculated by using a paired-samples t-test.
- Citation: Zhao J, Dong JN, Gong JF, Wang HG, Li Y, Zhang L, Zuo LG, Feng Y, Gu LL, Li N, Li JS, Zhu WM. Impact of enteral nutrition on energy metabolism in patients with Crohn’s disease. World J Gastroenterol 2015; 21(4): 1299-1304
- URL: https://www.wjgnet.com/1007-9327/full/v21/i4/1299.htm
- DOI: https://dx.doi.org/10.3748/wjg.v21.i4.1299


