Copyright
©The Author(s) 2015.
World J Gastroenterol. Jan 28, 2015; 21(4): 1243-1250
Published online Jan 28, 2015. doi: 10.3748/wjg.v21.i4.1243
Published online Jan 28, 2015. doi: 10.3748/wjg.v21.i4.1243
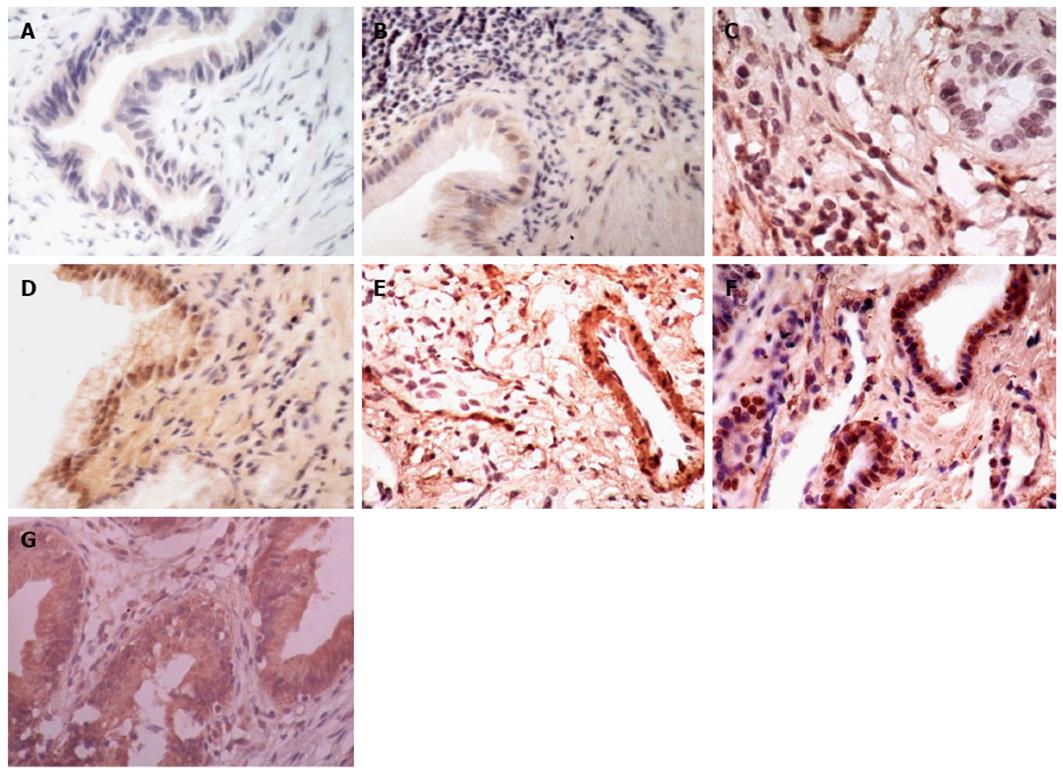
Figure 1 Typical histology corresponding to each histological score.
A, B, C, D, E, F, and G were scored as 0, 2, 3, 4, 5, 6, and 7, respectively.
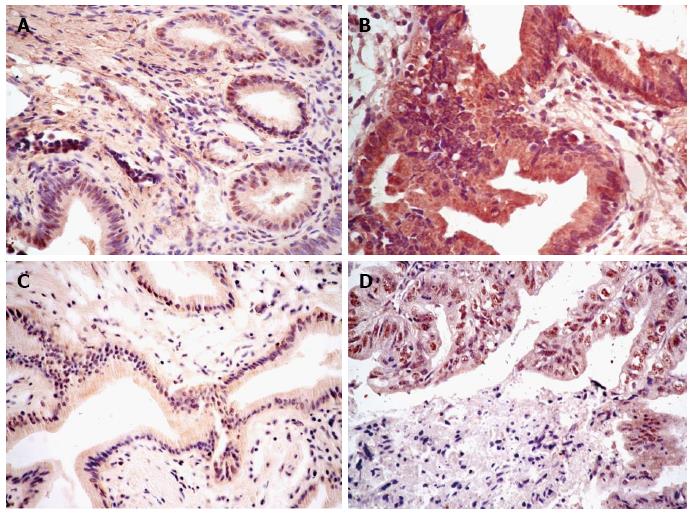
Figure 2 Immunohistochemical staining of estrogen receptor 1 and vascular endothelial growth factor A in gallbladder carcinoma and cholelithiasis specimens.
A: Low vascular endothelial growth factor A (VEGF-A) expression in cholelithiasis (CS) tissue; B: High VEGF-A expression in gallbladder carcinoma (GBC) tissue; C: Low estrogen receptor 1 (ER1) expression in CS tissue; D: High ER1 expression in GBC tissue.
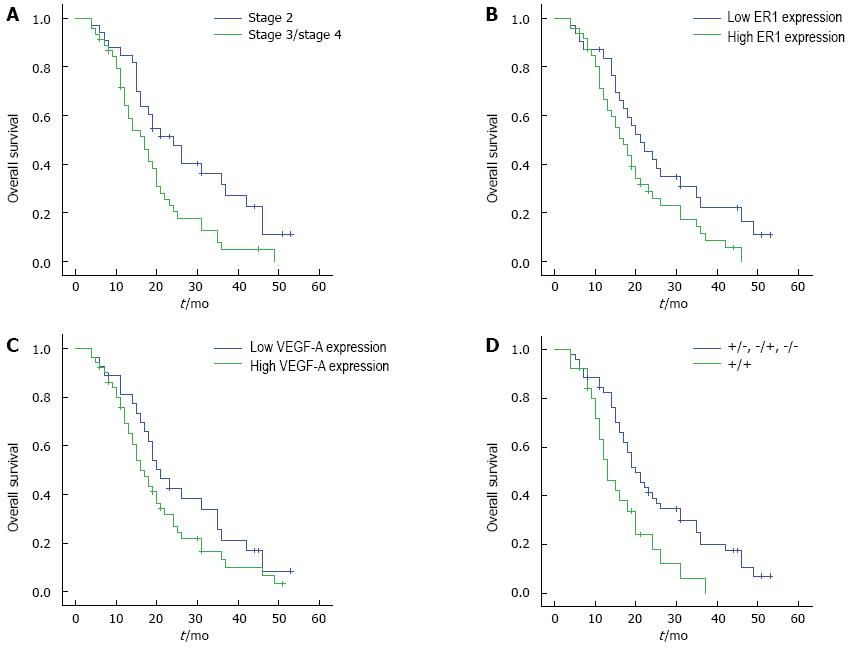
Figure 3 Kaplan-Meier survival curves.
A: Stratified for tumor node metastasis stage. Patients with stage 2 disease had a better prognosis than patients with stages 3 and 4 disease (P = 0.07); B: Stratified for estrogen receptor 1 expression status. Low estrogen receptor 1 (ER1) expression was associated with a better survival time than high ER1 expression, but there was no statistical significance between the two groups (P = 0.053); C: Stratified for vascular endothelial growth factor A expression status. Low vascular endothelial growth factor A (VEGF-A) expression was associated with a better survival time than high VEGF-A expression, but there was no statistical significance between two groups (P = 0.155); D: Stratified for estrogen receptor and vascular endothelial growth factor A expression. All patients were clarified into two groups: high expression of estrogen receptor1 (ER1) and vascular endothelial growth factor A (VEGF-A) group (+/+), and low expression of ER1 and VEGF-A group (+/-, -/+, -/-). Patients in high expression of ER1 and VEGF-A group had a worse prognosis than low expression of ER1 and VEGF-A group (P = 0.009). +/+: high ER1 expression and high VEGF-A expression; +/-: high ER1 expression and low VEGF-A expression; -/+: low ER1 expression and high VEGF-A expression; -/-: low ER1 expression and low VEGF-A expression.
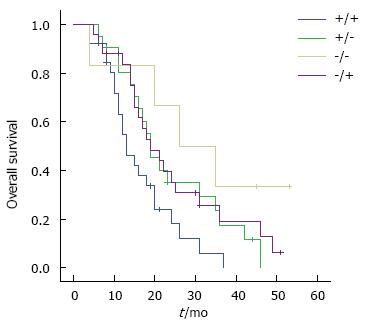
Figure 4 Kaplan-Meier survival curves stratified for estrogen receptor 1 and vascular endothelial growth factor A expression.
Patients with high expression of estrogen receptor1 (ER1) combined with vascular endothelial growth factor A (VEGF-A) (+/+) had worst prognosis than other groups (+/-,-/+,-/-) (P = 0.007). +/+: high ER1 expression and high VEGF-A expression; +/-: high ER1 expression and low VEGF-A expression; -/+: low ER1 expression and high VEGF-A expression; -/-: low ER1 expression and low VEGF-A expression.
- Citation: Zhang LQ, Xu XS, Wan Y, Song SD, Wang RT, Chen W, Wang ZX, Chang HL, Wei JC, Dong YF, Liu C. Prognostic implications of estrogen receptor 1 and vascular endothelial growth factor A expression in primary gallbladder carcinoma. World J Gastroenterol 2015; 21(4): 1243-1250
- URL: https://www.wjgnet.com/1007-9327/full/v21/i4/1243.htm
- DOI: https://dx.doi.org/10.3748/wjg.v21.i4.1243


