Copyright
©The Author(s) 2015.
World J Gastroenterol. Jan 28, 2015; 21(4): 1173-1181
Published online Jan 28, 2015. doi: 10.3748/wjg.v21.i4.1173
Published online Jan 28, 2015. doi: 10.3748/wjg.v21.i4.1173
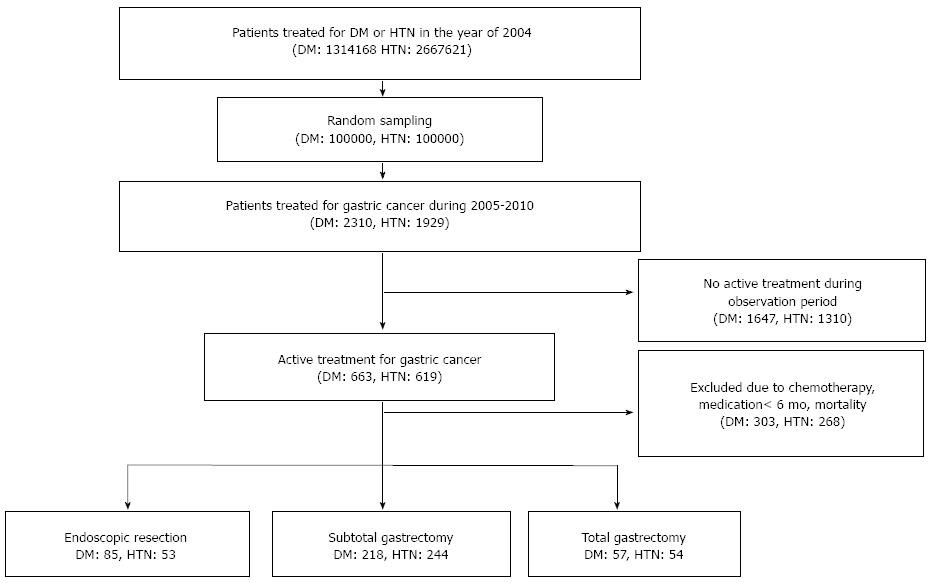
Figure 1 Flow chart of study population.
No treatment during the follow-up period due to precedent operation, patient’s condition, patients’ refusal, etc. DM: Diabetes mellitus; HTN: Hypertension.
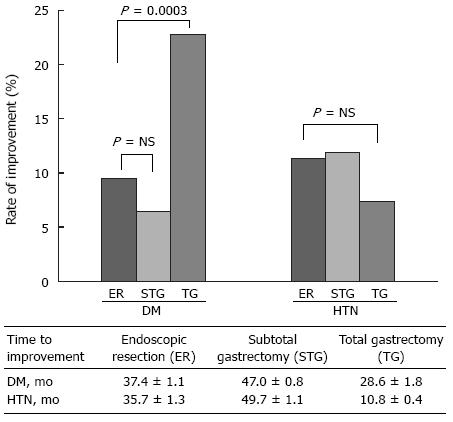
Figure 2 Comparison of improvement of diabetes mellitus or hypertension among endoscopic resection, subtotal gastrectomy and total gastrectomy.
DM: Diabetes mellitus; HTN: Hypertension; TG: Total gastrectomy; STG: Subtotal gastrectomy; ER: Endoscopic resection.
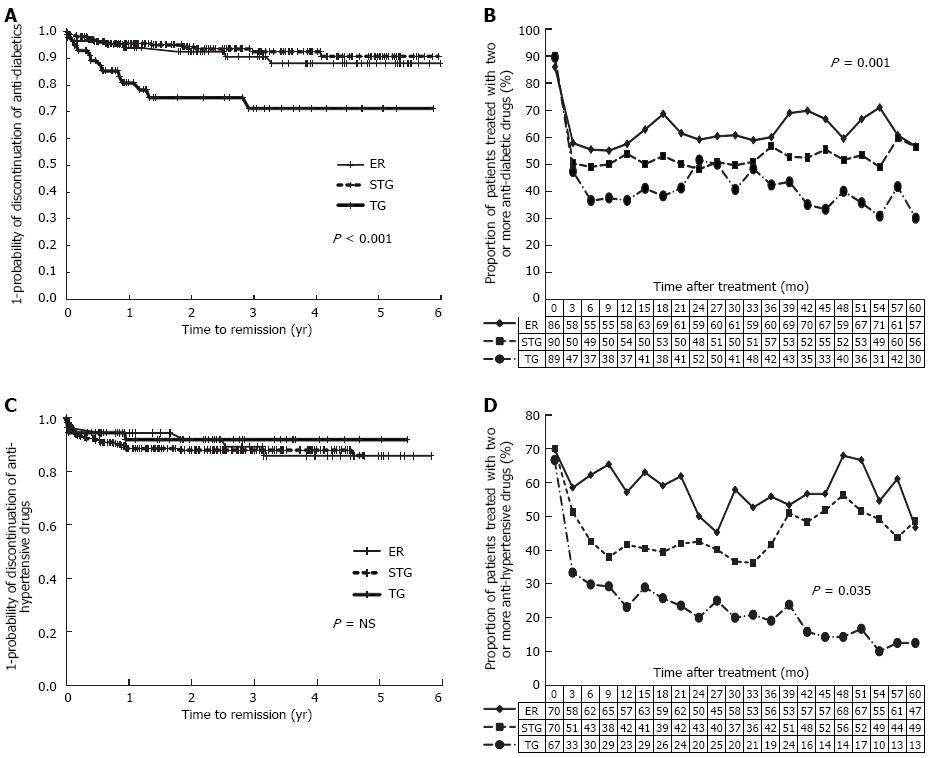
Figure 3 Time response of diabetes mellitus or hypertension after treatment of gastric cancer.
A: Kaplan-Meier estimate of probability of improvement of diabetes mellitus (DM) after treatment; B: Proportion of patients used two or more anti-diabetic drugs after treatment; C: Kaplan-Meier estimate of probability of improvement of hypertension (HTN) after treatment; D: Proportion of patients used two or more anti-hypertensive drugs after treatment. TG: Total gastrectomy; STG: Subtotal gastrectomy; ER: Endoscopic resection.
- Citation: Lee EK, Kim SY, Lee YJ, Kwak MH, Kim HJ, Choi IJ, Cho SJ, Kim YW, Lee JY, Kim CG, Yoon HM, Eom BW, Kong SY, Yoo MK, Park JH, Ryu KW. Improvement of diabetes and hypertension after gastrectomy: A nationwide cohort study. World J Gastroenterol 2015; 21(4): 1173-1181
- URL: https://www.wjgnet.com/1007-9327/full/v21/i4/1173.htm
- DOI: https://dx.doi.org/10.3748/wjg.v21.i4.1173


