Copyright
©The Author(s) 2015.
World J Gastroenterol. Jan 28, 2015; 21(4): 1117-1124
Published online Jan 28, 2015. doi: 10.3748/wjg.v21.i4.1117
Published online Jan 28, 2015. doi: 10.3748/wjg.v21.i4.1117
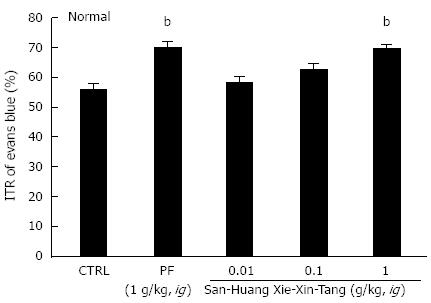
Figure 1 Effect of San-Huang-Xie-Xin-Tang extract on intestinal transit rate (%) in normal mice.
Mice (n = 7 for each bar, except for control) were treated with San-Huang-Xie-Xin-Tang extract and then intragastrically administered Evans blue 30 min later. Intestinal transit rate (ITR) (%) values were determined 30 min after Evans blue administration. Bars represent mean ± SE. bP < 0.01 vs control group. CTRL: Control; PF: Poncirus trifoliata Raf.
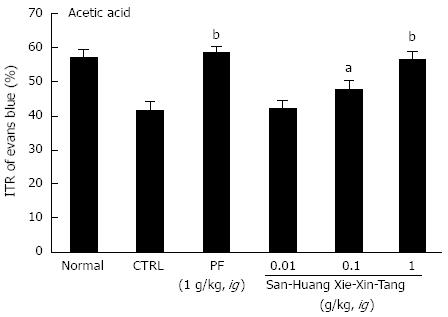
Figure 2 Effect of San-Huang-Xie-Xin-Tang extract on intestinal transit rate in acetic acid treated mice.
Mice (n = 6 for each bar) were treated with San-Huang-Xie-Xin-Tang extract and then intragastrically administered Evans blue 30 min later. Intestinal transit rate (ITR) (%) values were determined 30 min after Evans blue administration. Bars represent mean ± SE. aP < 0.05 vs control group; bP < 0.01 vs control group. CTRL: Control; PF: Poncirus trifoliata Raf.
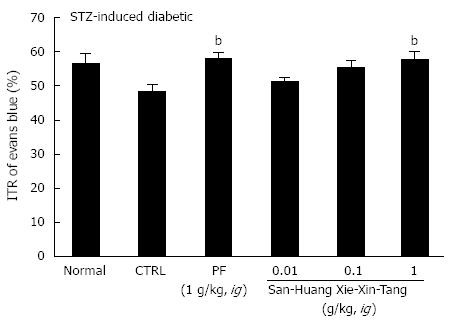
Figure 3 Effect of San-Huang-Xie-Xin-Tang extract on intestinal transit rate in streptozotocin-induced diabetic mice.
Two months after administering streptozotocin (STZ), mice (n = 7 for each bar) were treated with San-Huang-Xie-Xin-Tang extract and then intragastrically administered Evans blue 30 min later. Intestinal transit rate (ITR) (%) values were determined 30 min after Evans blue administration. Bars represent mean ± SE. bP < 0.01 vs control group. CTRL: Control; PF: Poncirus trifoliata Raf.
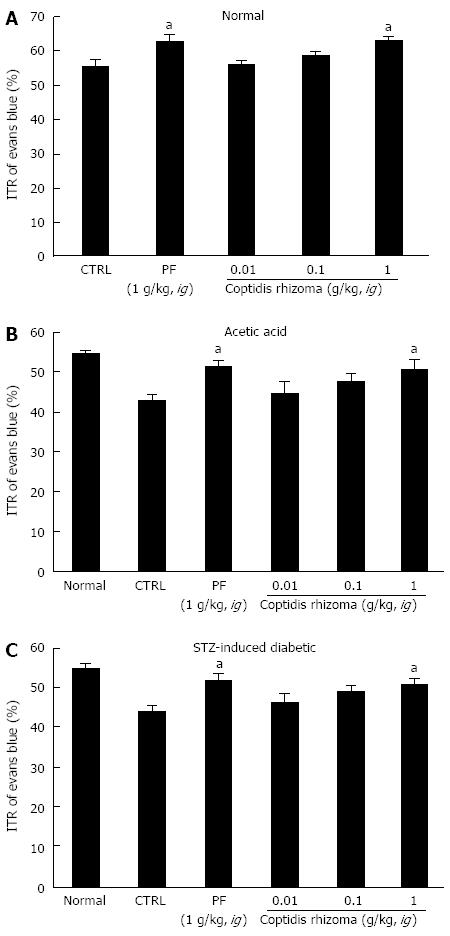
Figure 4 Effect of Coptidis rhizoma extract on intestinal transit rate in normal mice and mice with gastrointestinal motility dysfunction.
Intestinal transit rate (ITR) values were determined 30 min following the intragastric administration of an Evans blue solution to normal mice (A), to mice 30 min after the induction of acetic acid (B), and to mice 2 mo after the induction of streptozotocin (STZ) (C) with Coptidis rhizoma extract. Bars represent mean ± SE. aP < 0.05 vs control group. CTRL: Control; PF: Poncirus trifoliata Raf.
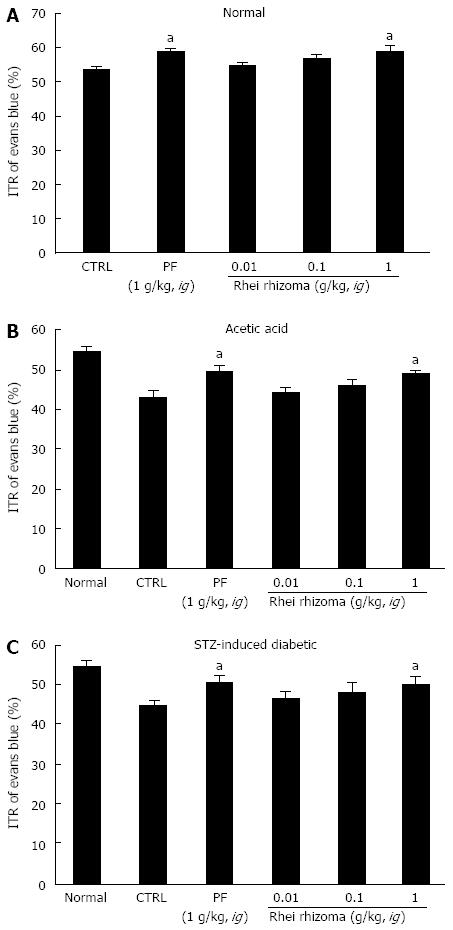
Figure 5 Effect of Rhei rhizoma extract on intestinal transit rate in normal mice and mice with gastrointestinal motility dysfunction.
Intestinal transit rate (ITR) values were determined 30 min following the intragastric administration of an Evans blue solution to normal mice (A), to mice 30 min after the induction of acetic acid (B) and to mice 2 mo after the induction of streptozotocin (STZ) (C) with Rhei rhizoma extract. Bars represent mean ± SE. aP < 0.05 vs control group. CTRL: Control. PF: Poncirus trifoliata Raf.
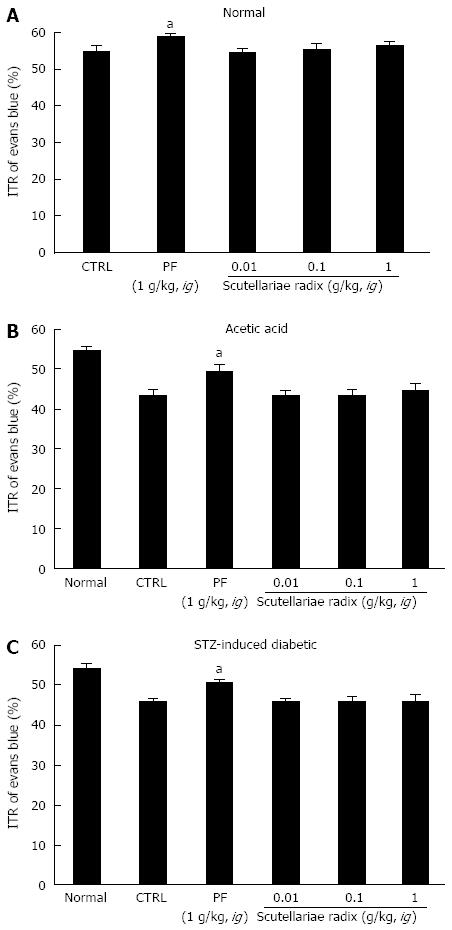
Figure 6 Effect of Scutellariae radix extract on intestinal transit rate in normal mice and mice with gastrointestinal motility dysfunction.
Intestinal transit rate (ITR) values were determined 30 min following intragastric administration of an Evans blue solution to normal mice (A), mice 30 min after the induction of acetic acid (B) and to mice 2 mo after the induction of streptozotocin (STZ) (C) with Scutellariae radix extract. Bars represent mean ± SE. aP < 0.05 vs control group. CTRL: Control. PF: Poncirus trifoliata Raf.
- Citation: Hwang MW, Ahn TS, Hong NR, Jeong HS, Jung MH, Ha KT, Kim BJ. Effects of traditional Chinese herbal medicine San-Huang-Xie-Xin-Tang on gastrointestinal motility in mice. World J Gastroenterol 2015; 21(4): 1117-1124
- URL: https://www.wjgnet.com/1007-9327/full/v21/i4/1117.htm
- DOI: https://dx.doi.org/10.3748/wjg.v21.i4.1117


