Copyright
©The Author(s) 2015.
World J Gastroenterol. Oct 21, 2015; 21(39): 11168-11178
Published online Oct 21, 2015. doi: 10.3748/wjg.v21.i39.11168
Published online Oct 21, 2015. doi: 10.3748/wjg.v21.i39.11168
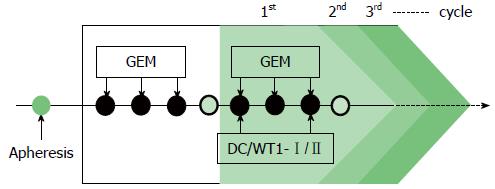
Figure 1 Treatment schedule for patients with pancreatic ductal adenocarcinoma.
The patients were treated with gemcitabine alone, followed by dendritic cells pulsed with a Wilms’ tumor 1 (WT1)-specific peptide mixture restricted by multiple major histocompatibility complex (MHC) class I and II molecules (DC/WT1-I/II) in combination with gemcitabine or S-1, an oral 5-fluorouracil (5-FU). GEM: Gemcitabine.
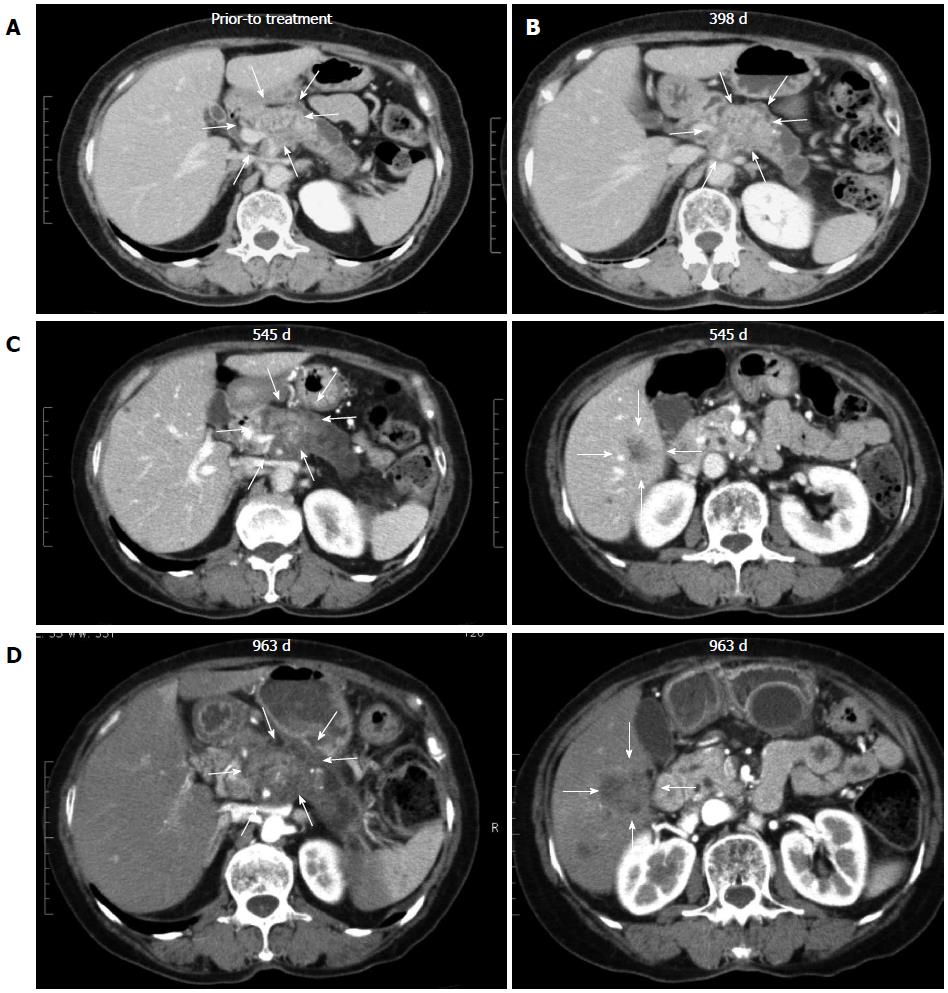
Figure 2 Response assessment in a super-responder, case 6.
A: Computed tomography (CT) imaging of case 6 revealing pancreatic body cancer before treatment and no liver metastases; B: CT imaging after chemoimmunotherapy revealed that local pancreatic lesions were stable; C: Local pancreatic lesions were stable (left panel), multiple liver metastases appeared at 545 d after the first treatment (right panel); D: Local pancreatic lesions were stable (left panel), the sizes of multiple liver metastases were markedly increased at 963 d after the first treatment (right panel).
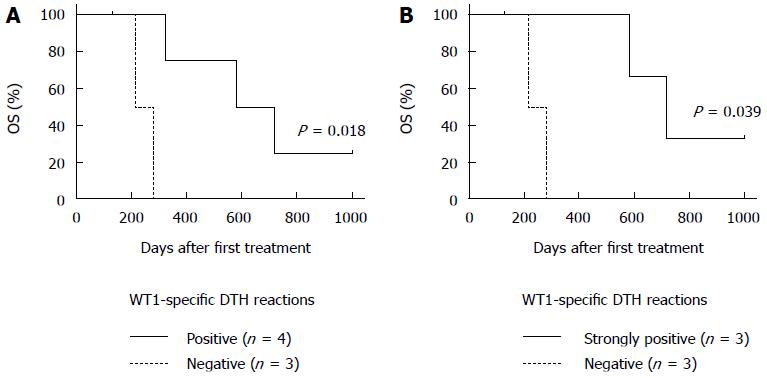
Figure 3 Association of Wilms’ tumor 1-specific delayed-type hypersensitivity reactions with overall survival.
Kaplan-Meier estimates of overall survival (OS) for patients with PDA treated with dendritic cells (DCs) pulsed with Wilms’ tumor 1 (WT1) MHC class I and -II peptides (DC/WT1-I/II) combined with chemotherapy. A: OS in WT1-specific delayed type hypersensitivity (DTH)-positive (n = 4) or -negative (n = 3) responders; B: OS in strongly WT1-specific DTH-positive (n = 3) or -negative (n = 3) responders.
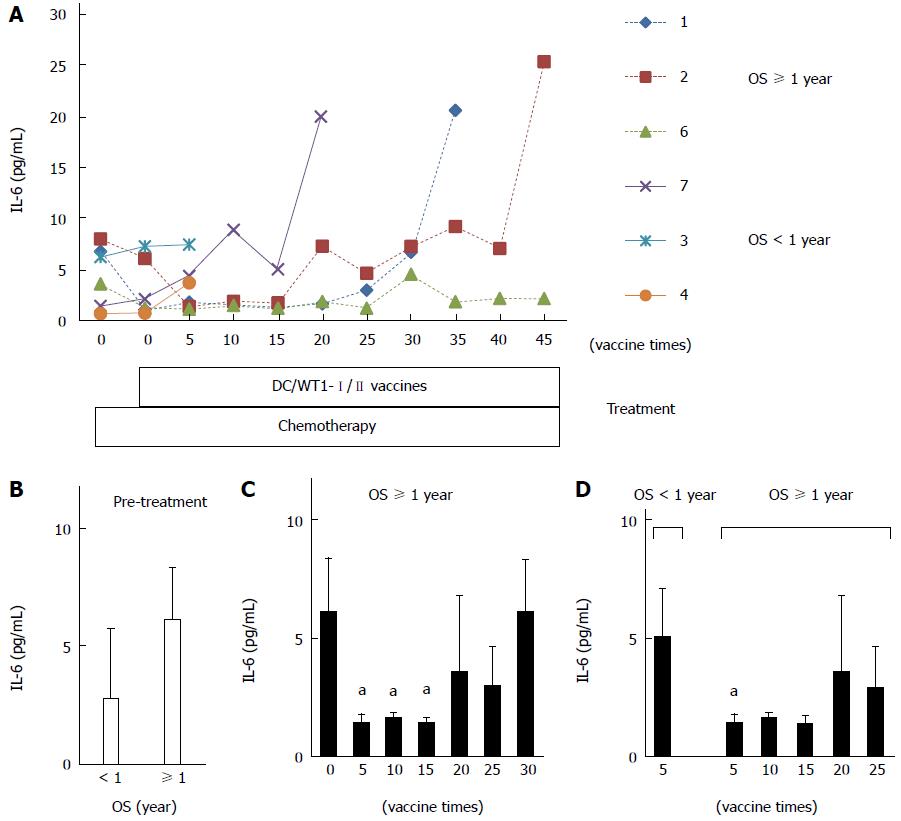
Figure 4 Plasma interleukin-6 levels in pancreatic ductal adenocarcinoma patients receiving chemoimmunotherapy.
A: Plasma interleukin (IL)-6 levels in 6 patients during treatment; B: Comparison of plasma IL-6 levels prior to treatment between super-responders [overall survival (OS) ≥ 1 year] and nonsuper-responders (OS < 1 year); C: Comparison of plasma IL-6 levels in super-responders prior to treatment and post-vaccination; D: Comparison of plasma IL-6 levels after 5 vaccinations between nonsuper-responders and super-responders after 5, 10, 15, 20, and 25 vaccinations. The values are expressed as mean ± SD. aP < 0.05.
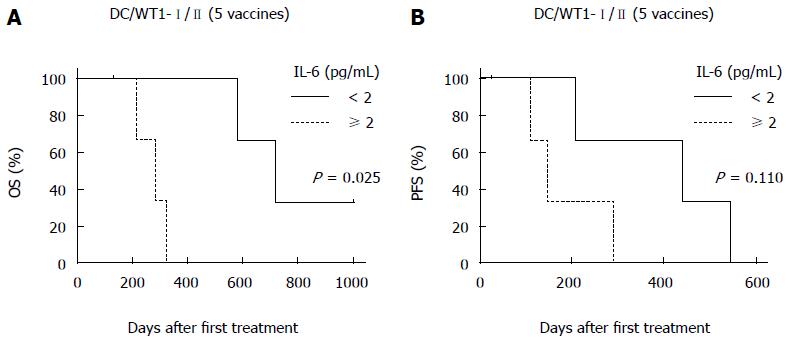
Figure 5 Association of plasma interleukin-6 levels with overall survival and progression-free survival.
The plasma interleukin (IL)-6 levels of 7 pancreatic ductal adenocarcinoma patients receiving chemoimmunotherapy were analyzed after 5 vaccinations. Kaplan-Meier estimates of OS (A) and PFS (B) in these patients.
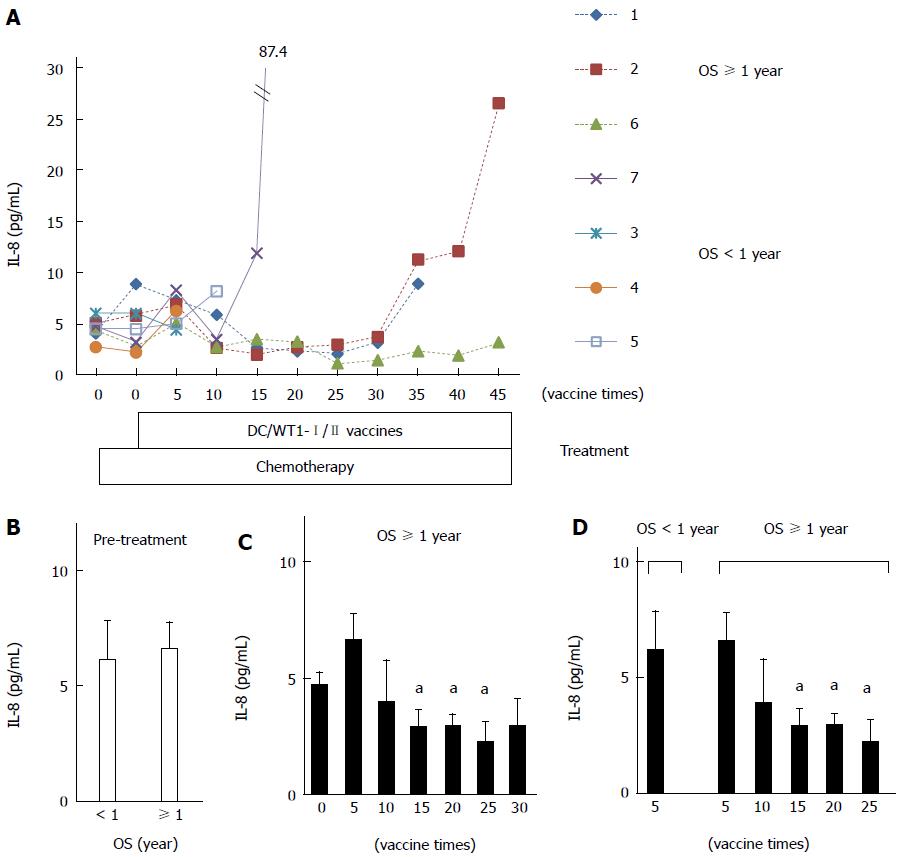
Figure 6 Plasma interleukin-8 levels in pancreatic ductal adenocarcinoma patients receiving chemoimmunotherapy.
A: Plasma interleukin (IL)-8 levels in 7 patients during treatment; B: Comparison of plasma IL-8 levels prior to treatment between super-responders [overall survival (OS) ≥ 1 year] and nonsuper-responders (OS < 1 year); C: Comparison of plasma IL-8 levels in super-responders prior to treatment and post-vaccination; D: Comparison of plasma IL-8 levels after 5 vaccinations in nonsuper-responders and super-responders after 5, 10, 15, 20, and 25 vaccinations. The values are expressed as means ± SD. aP < 0.05.
- Citation: Tsukinaga S, Kajihara M, Takakura K, Ito Z, Kanai T, Saito K, Takami S, Kobayashi H, Matsumoto Y, Odahara S, Uchiyama K, Arakawa H, Okamoto M, Sugiyama H, Sumiyama K, Ohkusa T, Koido S. Prognostic significance of plasma interleukin-6/-8 in pancreatic cancer patients receiving chemoimmunotherapy. World J Gastroenterol 2015; 21(39): 11168-11178
- URL: https://www.wjgnet.com/1007-9327/full/v21/i39/11168.htm
- DOI: https://dx.doi.org/10.3748/wjg.v21.i39.11168


