Copyright
©The Author(s) 2015.
World J Gastroenterol. Oct 21, 2015; 21(39): 11118-11126
Published online Oct 21, 2015. doi: 10.3748/wjg.v21.i39.11118
Published online Oct 21, 2015. doi: 10.3748/wjg.v21.i39.11118
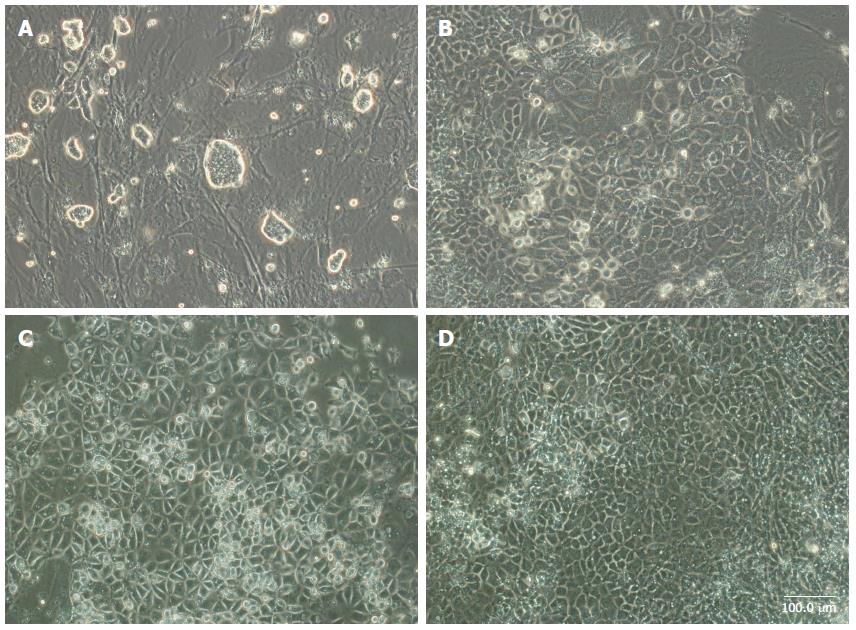
Figure 1 Morphological changes of rat induced pluripotent stem cells at different stages of differentiation.
A: Undifferentiated induced pluripotent stem cells; B: Differentiated cells on day 5; C: Differentiated cells on day 15; D: Differentiated cells on day 20. Scale bar = 100 μm.
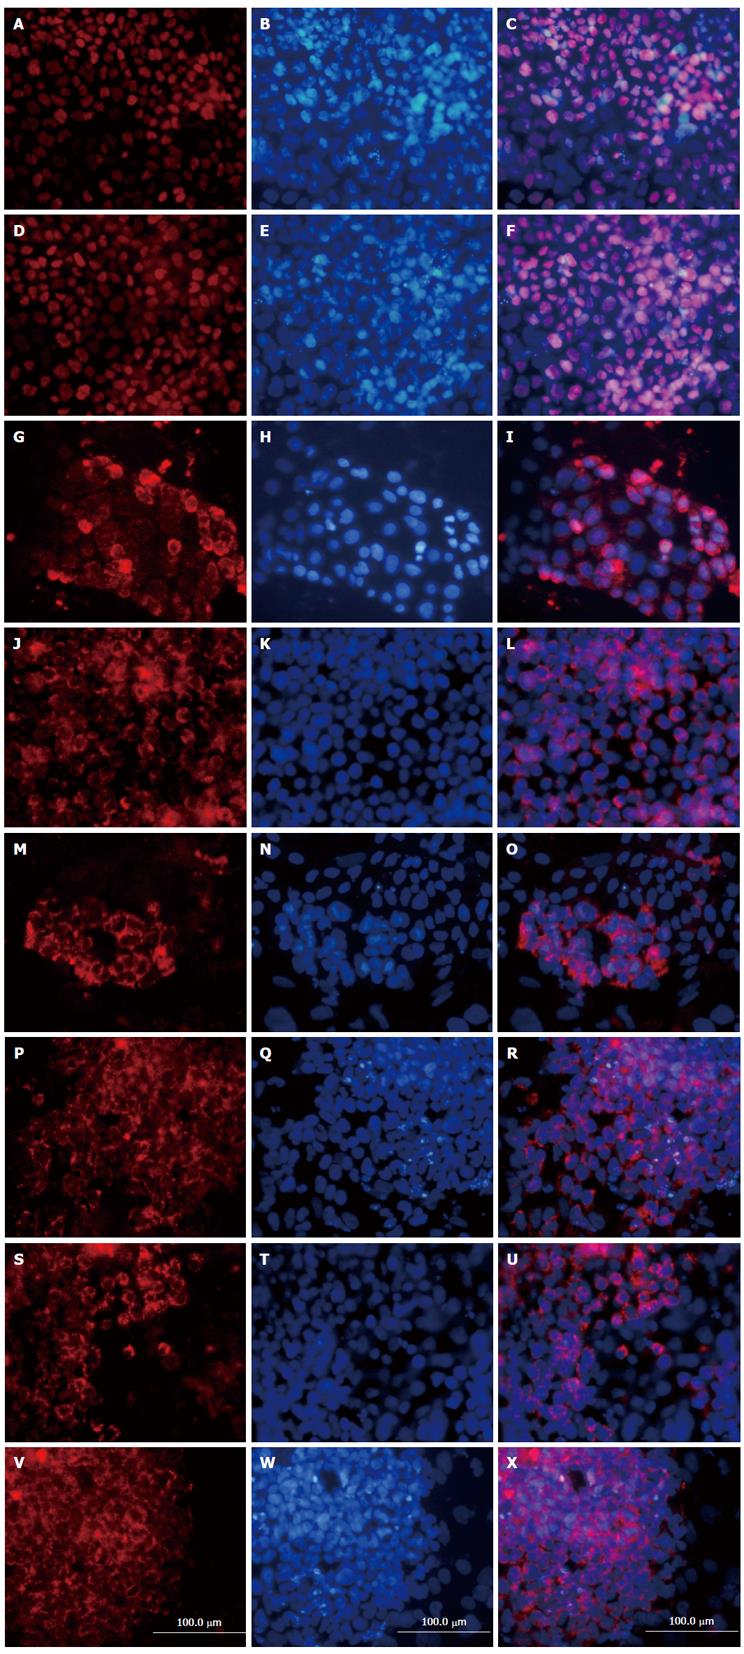
Figure 2 Protein expression in differentiated induced pluripotent stem cells on days 5 and 20 as indicated by immunofluorescence staining.
A, B, C: FOXA2; D, E, F: SOX17; G, H, I: AFP; J, K, L: ALB; M, N, O: CYP1A2; P, Q, R: CYP3A4; S, T, U: AAT; V, W, X: CK18. Nuclei were stained blue with DAPI. Scale bar = 100 μm. FOXA2: Forkhead box protein A2; SOX17: SRY-box containing gene 17; AFP: α-fetoprotein; ALB: Albumin; CYP1A2: Cytochrome P450 1A2; AAT: α1-antitrypsin.
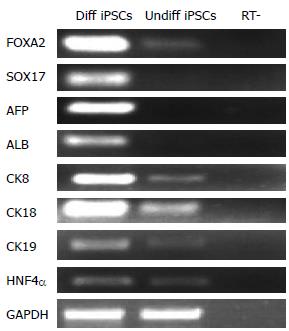
Figure 3 RT-PCR analysis of differentiated induced pluripotent stem cells on days 5 and 20.
Differentiated cells expressed endodermal markers FOXA2 and SOX17 after 5 d of endoderm induction. Liver associated genes AFP, ALB, CK8, CK18, CK19, and HNF-4α mRNA were expressed on day 20. H2O served as a negative control. FOXA2: Forkhead box protein A2; SOX17: SRY-box containing gene 17; AFP: α-fetoprotein; ALB: Albumin; iPSCs: Induced pluripotent stem cells.
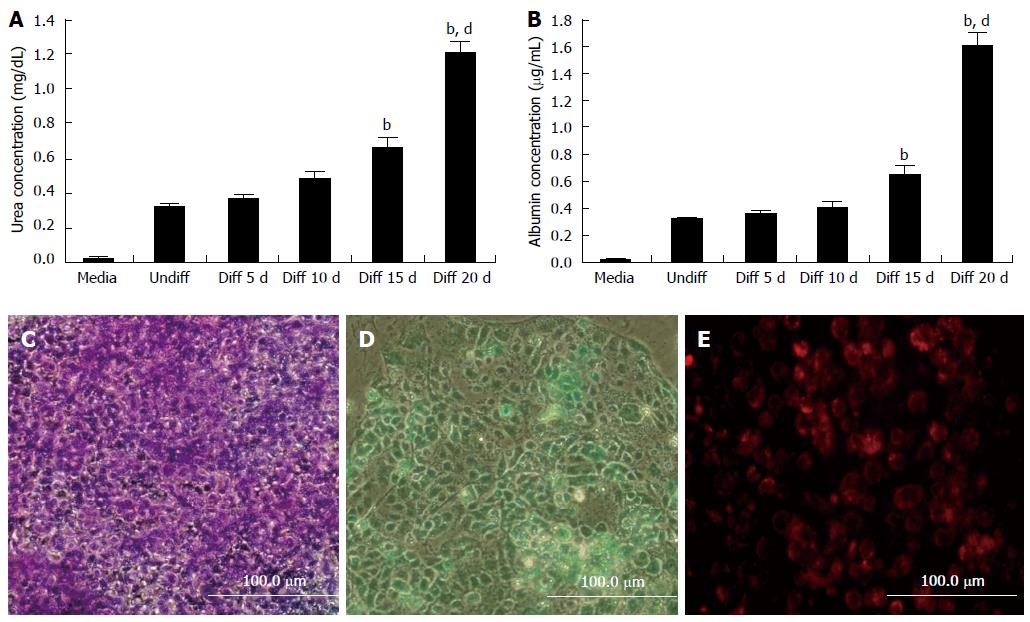
Figure 4 Functional analysis of differentiated induced pluripotent stem cells.
A: Urea production of differentiated induced pluripotent stem cells (iPSCs); B: Albumin secretion of differentiated iPSCs; C: Glycogen synthesis of differentiated iPSCs as indicated by PAS staining on day 20; D: ICG uptake test of differentiated iPSCs; E: LDL uptake test of differentiated iPSCs. Scale bar = 100 μm. bP < 0.01 vs undifferentiated cells; dP < 0.01 vs differentiated cells on day 15.
-
Citation: Sun C, Hu JJ, Pan Q, Cao Y, Fan JG, Li GM. Hepatic differentiation of rat induced pluripotent stem cells
in vitro . World J Gastroenterol 2015; 21(39): 11118-11126 - URL: https://www.wjgnet.com/1007-9327/full/v21/i39/11118.htm
- DOI: https://dx.doi.org/10.3748/wjg.v21.i39.11118


