Copyright
©The Author(s) 2015.
World J Gastroenterol. Sep 28, 2015; 21(36): 10453-10460
Published online Sep 28, 2015. doi: 10.3748/wjg.v21.i36.10453
Published online Sep 28, 2015. doi: 10.3748/wjg.v21.i36.10453
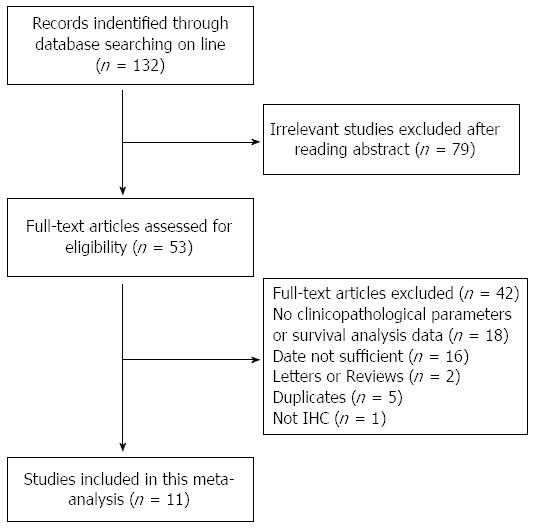
Figure 1 Flow chart of the study selection process.
Figure 2 Forest plot of hazard ratio for association between decreased Muc5AC expression and overall survival of patients with gastric cancer.
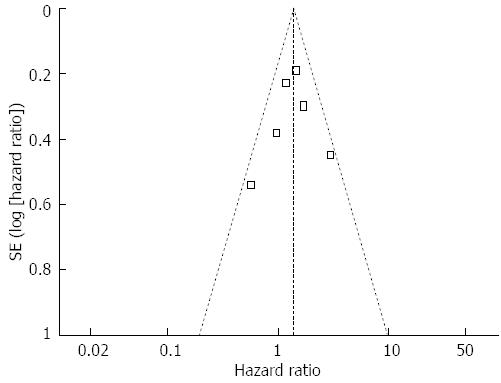
Figure 3 Funnel plot of decreased Muc5AC expression and overall survival of patients with gastric cancer.
Figure 4 Forest plot of odds ratio for association between decreased Muc5AC expression and depth of tumour invasion in patients with gastric cancer.
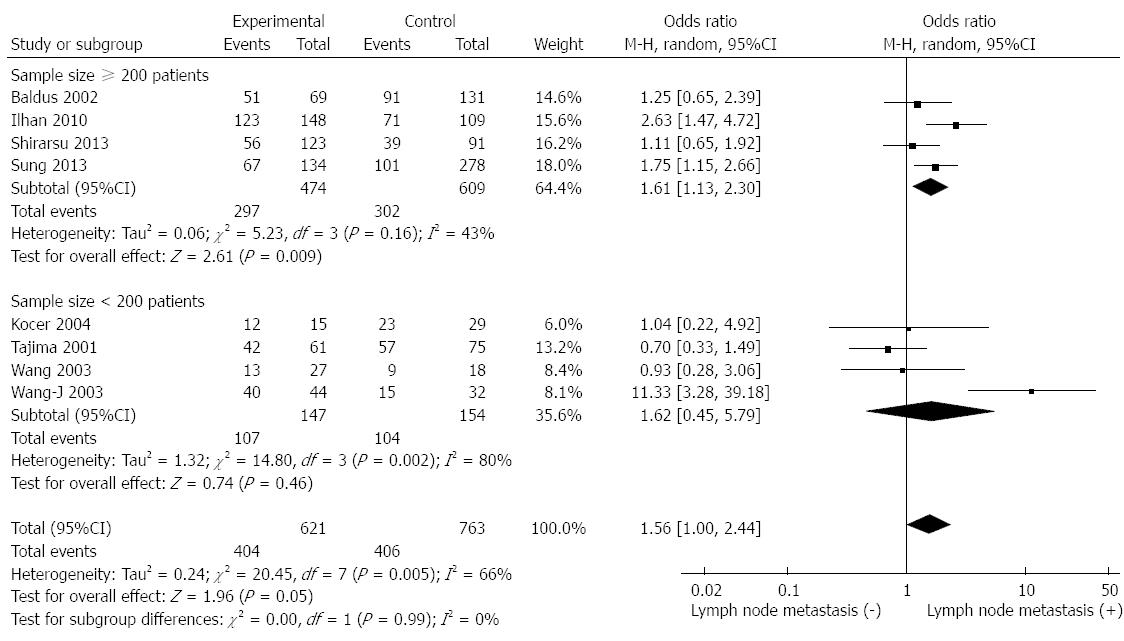
Figure 5 Forest plot of odds ratio for association between decreased Muc5AC expression and lymph node metastasis in patients with gastric cancer.
- Citation: Zhang CT, He KC, Pan F, Li Y, Wu J. Prognostic value of Muc5AC in gastric cancer: A meta-analysis. World J Gastroenterol 2015; 21(36): 10453-10460
- URL: https://www.wjgnet.com/1007-9327/full/v21/i36/10453.htm
- DOI: https://dx.doi.org/10.3748/wjg.v21.i36.10453


