Copyright
©The Author(s) 2015.
World J Gastroenterol. Sep 28, 2015; 21(36): 10367-10374
Published online Sep 28, 2015. doi: 10.3748/wjg.v21.i36.10367
Published online Sep 28, 2015. doi: 10.3748/wjg.v21.i36.10367
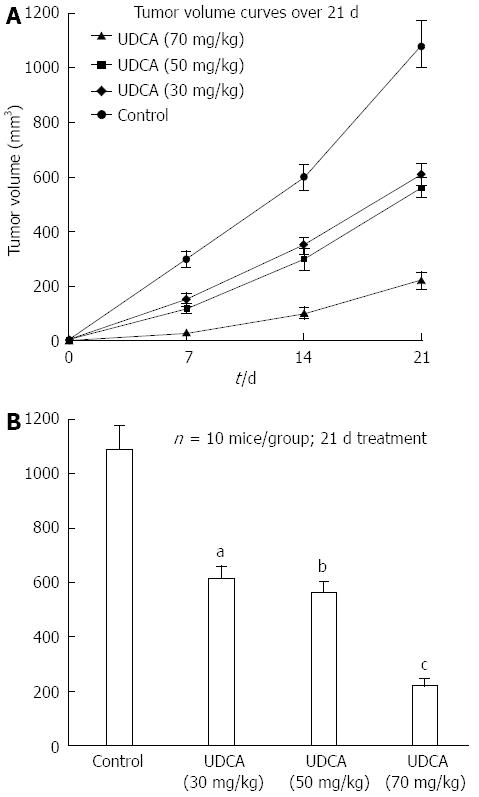
Figure 1 Ursodeoxycholic acid suppresses tumor growth in vivo.
A: Tumor volume is plotted as a function of time in days. Tumor volumes plotted represent the median value of xenografts from 10 animals in each group; B: The median value of the tumor volume for each group after 21 d of treatment are graphically depicted. Differences between control and treated xenografts on day 21 reached statistical significance (P < 0.05) at all ursodeoxycholic acid (UDCA) doses (30 mg/kg per day, aP < 0.05; 50 mg/kg per day, bP < 0.05; 70 mg/kg per day, cP < 0.01).
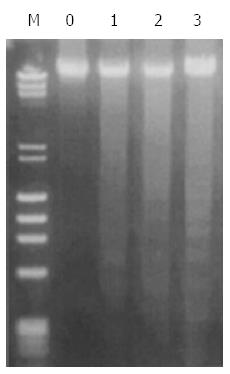
Figure 2 Ursodeoxycholic acid induces a DNA ladder in hepatocellular carcinoma xenografts in mice.
Genomic DNA was isolated from xenografts and electrophoresed on 1.5% agarose gels to determine integrity of the DNA. M: DNA markers; lane 0: control; lanes 1-3: ursodeoxycholic acid (UDCA) 30 mg/kg per day, UDCA 50 mg/kg per day, and UDCA 70 mg/kg per day.
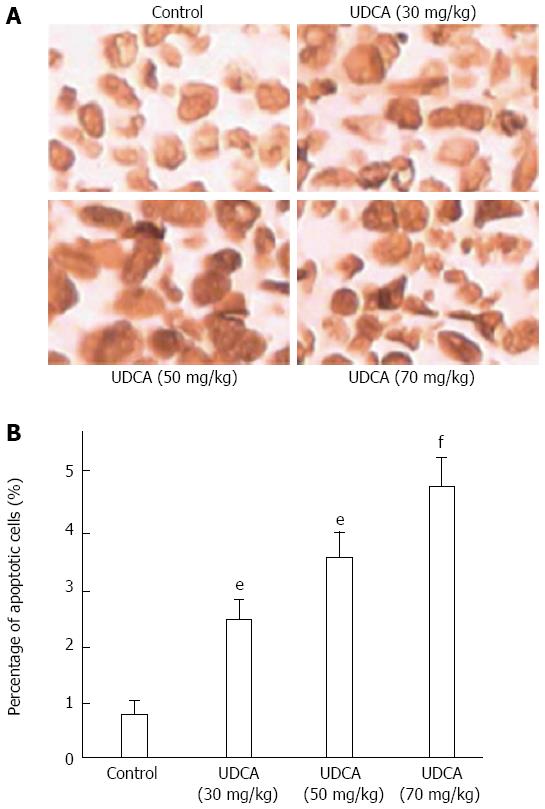
Figure 3 Systemic administration of ursodeoxycholic acid induces apoptosis in BEL7402 xenografts in immunodeficient mice.
A: TUNEL staining performed to detect apoptotic cells in situ in tissue sections prepared from control and treated xenografts as indicated (magnification × 400); B: Apoptotic cell numbers from control and treated xenografts represented graphically. Data are presented as the mean ± SD for 1000 cells in randomly selected fields on three sections for each group. Differences between control and treated xenografts reached statistical significance (30 mg/kg per day, aP < 0.05; 50 mg/kg per day, eP < 0.05; 70 mg/kg per day, fP < 0.01).
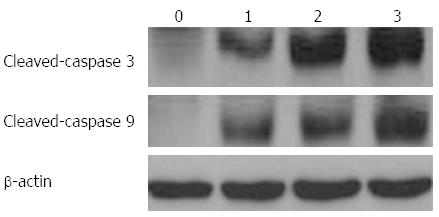
Figure 4 Expression of cleaved-caspases 3 and 9 is induced in response to ursodeoxycholic acid in xenografts.
Western blot analysis was performed with protein lysates prepared from control and treated tumors. Blots were incubated with antibody against cleaved-caspases 3 and 9, and β-actin was used as an internal control. 0: Control; lanes 1-3: Ursodeoxycholic acid (UDCA) 30 mg/kg per day, UDCA 50 mg/kg per day, and UDCA 70 mg/kg per day.
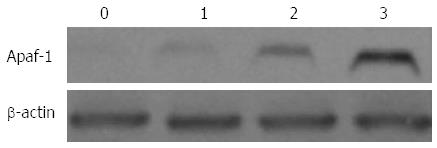
Figure 5 Ursodeoxycholic acid induces expression of APAF1.
Western blot analysis for the expression of APAF1 was performed with protein lysates prepared from control and treated xenografts. 0: control; 1-3 lanes: ursodeoxycholic acid (UDCA) 30 mg/kg per day, 50 mg/kg per day, and UDCA 70 mg/kg per day. β-actin was used as an internal control.
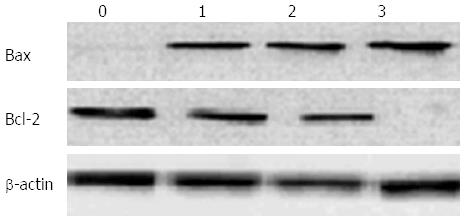
Figure 6 Ursodeoxycholic acid induces BAX but suppresses BCL2 protein levels.
Western blot analysis for the expression of BAX and BCL2 proteins was performed with protein lysates prepared from control and treated xenografts. 0: control; lanes 1-3: ursodeoxycholic acid (UDCA) 30 mg/kg per day, UDCA 50 mg/kg per day, and UDCA 70 mg/kg per day. β-actin was used as an internal control.
Figure 7 Cytochrome c is localized to the cytosolic fraction in response to ursodeoxycholic acid.
Western blot analysis for the localization of cytochrome c was performed with protein lysates prepared from cytosolic and mitochondrial cellular fractions in control and treated xenografts. β-actin and oxidative complex I were used as marker and loading controls for cytosolic and mitochondrial fractions, respectively.
- Citation: Liu H, Xu HW, Zhang YZ, Huang Y, Han GQ, Liang TJ, Wei LL, Qin CY, Qin CK. Ursodeoxycholic acid induces apoptosis in hepatocellular carcinoma xenografts in mice. World J Gastroenterol 2015; 21(36): 10367-10374
- URL: https://www.wjgnet.com/1007-9327/full/v21/i36/10367.htm
- DOI: https://dx.doi.org/10.3748/wjg.v21.i36.10367


