Copyright
©The Author(s) 2015.
World J Gastroenterol. Sep 21, 2015; 21(35): 10072-10079
Published online Sep 21, 2015. doi: 10.3748/wjg.v21.i35.10072
Published online Sep 21, 2015. doi: 10.3748/wjg.v21.i35.10072
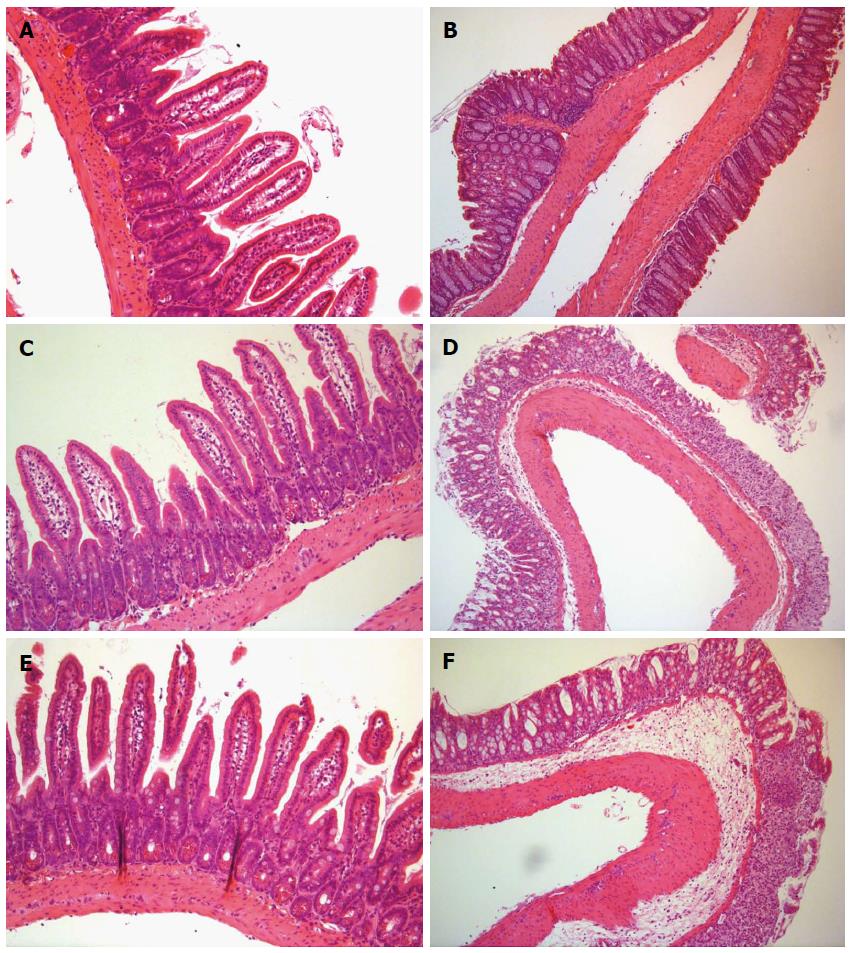
Figure 1 Small and large intestine histology.
Hematoxylin eosin-stained tissue preparations of Control (A), 3% DSS (C) and 5% DSS (E) small intestines and Control (B), 3% DSS (D) and 5% DSS (F) large intestines. In D and F, crypt structure is damaged and mucosa is partly eroded. Edema is present in submucosa. Immune cells are present in mucosa and submucosa. Magnification × 20. DSS: Dextran sodium sulfate.
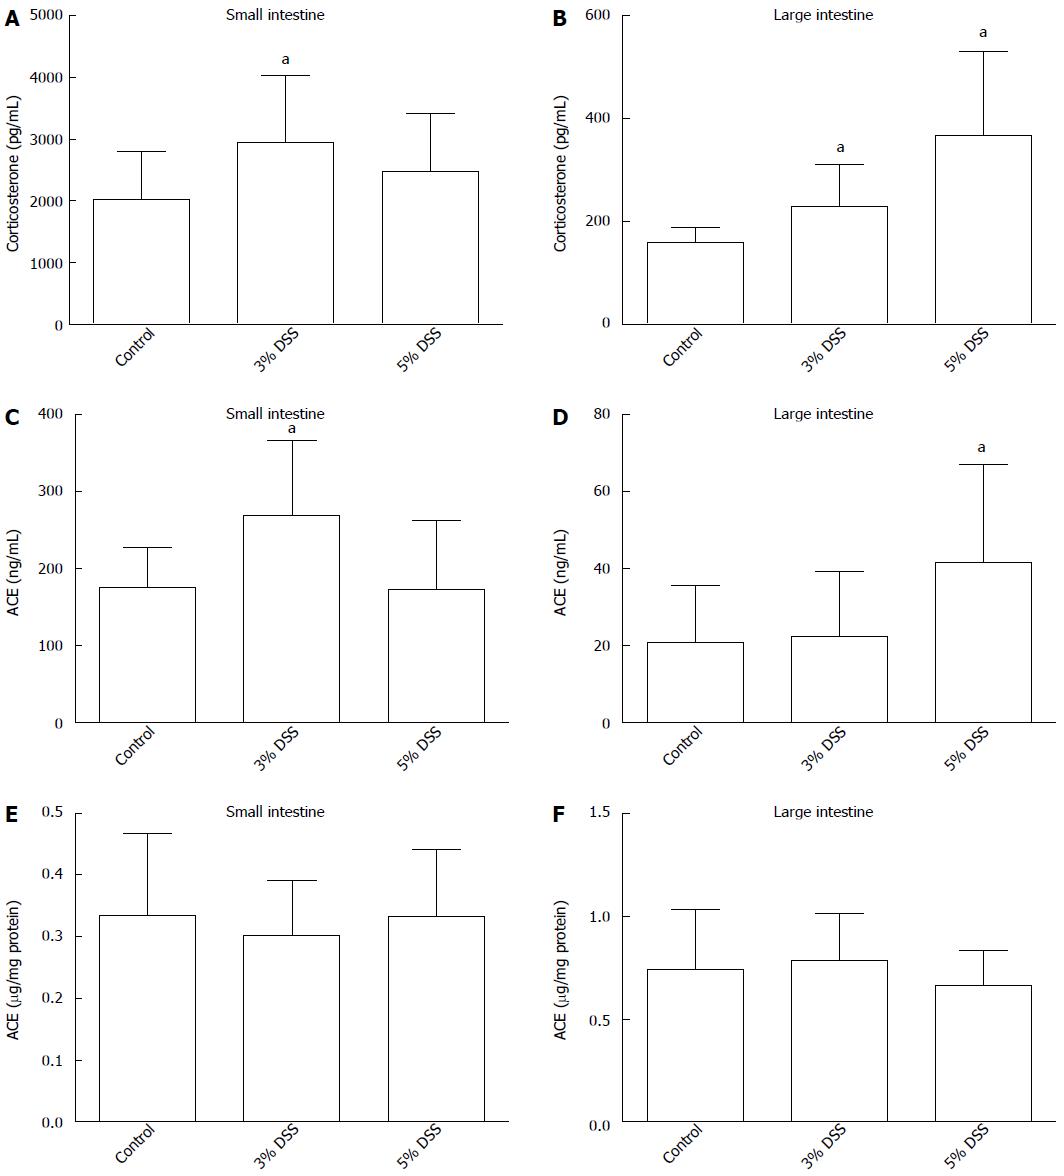
Figure 2 Corticosterone production and angiotensin-I converting enzyme shedding measured from healthy (control) and inflamed (DSS 3% or 5% induced in drinking fluid for 7 d) intestine samples (n = 8) after 90 min at 37 °C.
All the conditions were pretested in pilot experiments. Corticosterone production measured from the incubate buffer small intestine (A), large intestine (B). ACE shedding into incubate small intestine (C), large intestine (D). Tissue bound ACE from tissue lysate small intestine (E), large intestine (F). Data expressed as mean ± SD, n = 8 in each column. aP < 0.05 vs control. ACE: Angiotensin-I converting enzyme; DSS: Dextran sodium sulfate.
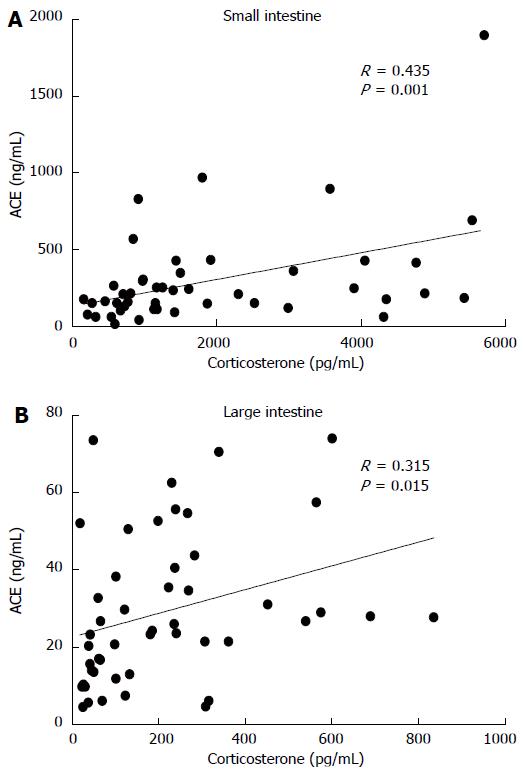
Figure 3 Correlation of angiotensin-I converting enzyme protein and corticosterone in ex vivo intestinal incubations.
A: Small intestine, n = 23; B: Large intestine, n = 24.
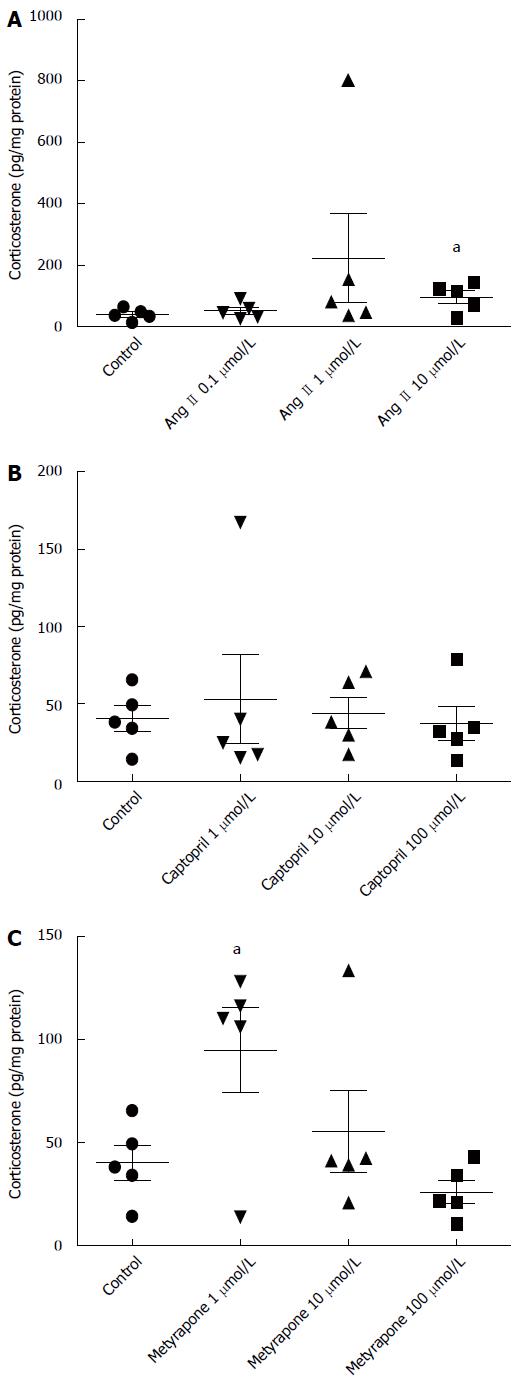
Figure 4 Concentration-response effects of three different concentrations of angiotensin (A), captopril (B) and metyrapone (C) on corticosterone production measured from incubation buffer of small intestine sample after 90 min at 37 °C.
Individual values, mean ± SD from (n = 5 in each concentration) are given. aP < 0.05 vs control.
- Citation: Salmenkari H, Issakainen T, Vapaatalo H, Korpela R. Local corticosterone production and angiotensin-I converting enzyme shedding in a mouse model of intestinal inflammation. World J Gastroenterol 2015; 21(35): 10072-10079
- URL: https://www.wjgnet.com/1007-9327/full/v21/i35/10072.htm
- DOI: https://dx.doi.org/10.3748/wjg.v21.i35.10072


