Copyright
©The Author(s) 2015.
World J Gastroenterol. Sep 14, 2015; 21(34): 9945-9956
Published online Sep 14, 2015. doi: 10.3748/wjg.v21.i34.9945
Published online Sep 14, 2015. doi: 10.3748/wjg.v21.i34.9945
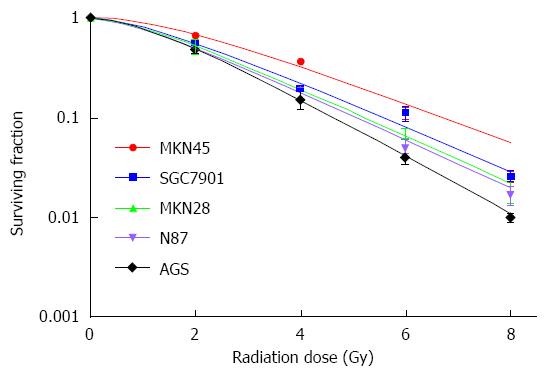
Figure 1 Clonogenic survival of 5 gastric cancer cell lines after ionizing radiation.
Cells were seeded into 6-well plates as indicated and exposed to corresponding doses of ionizing radiation after overnight recovery. Cells were incubated for 10 to 14 d to form colonies, then fixed with methyl alcohol and stained with 1% crystal violet solution. Colonies were counted and surviving fractions were calculated. Cell survival curves were fitted using Graphpad Prism 5.1 software according to the multi-target single hit model. Dots and bars: mean ± SD.
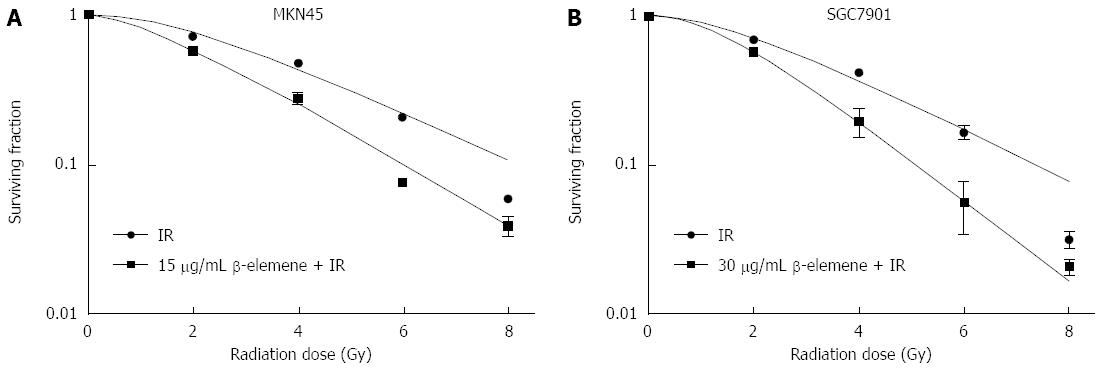
Figure 2 β-elemene pretreatment decreases clonogenic survival following ionizing radiation in gastric cancer cells.
Cells were seeded into 6-well plates as indicated. After 4 to 6 h attachment, cells were treated with or without β-elemene for 18 h, followed by exposure to the indicated doses of IR. Then, cells were incubated as described above and colonies were counted. Cell survival curves were fitted using Graphpad Prism 5.1 software according to the multi-target single hit model. The results are representative of duplicate independent experiments. A: MKN45 cell line; B: SGC7901 cell line; Dots and bars: mean ± SD. IR: Ionizing radiation.
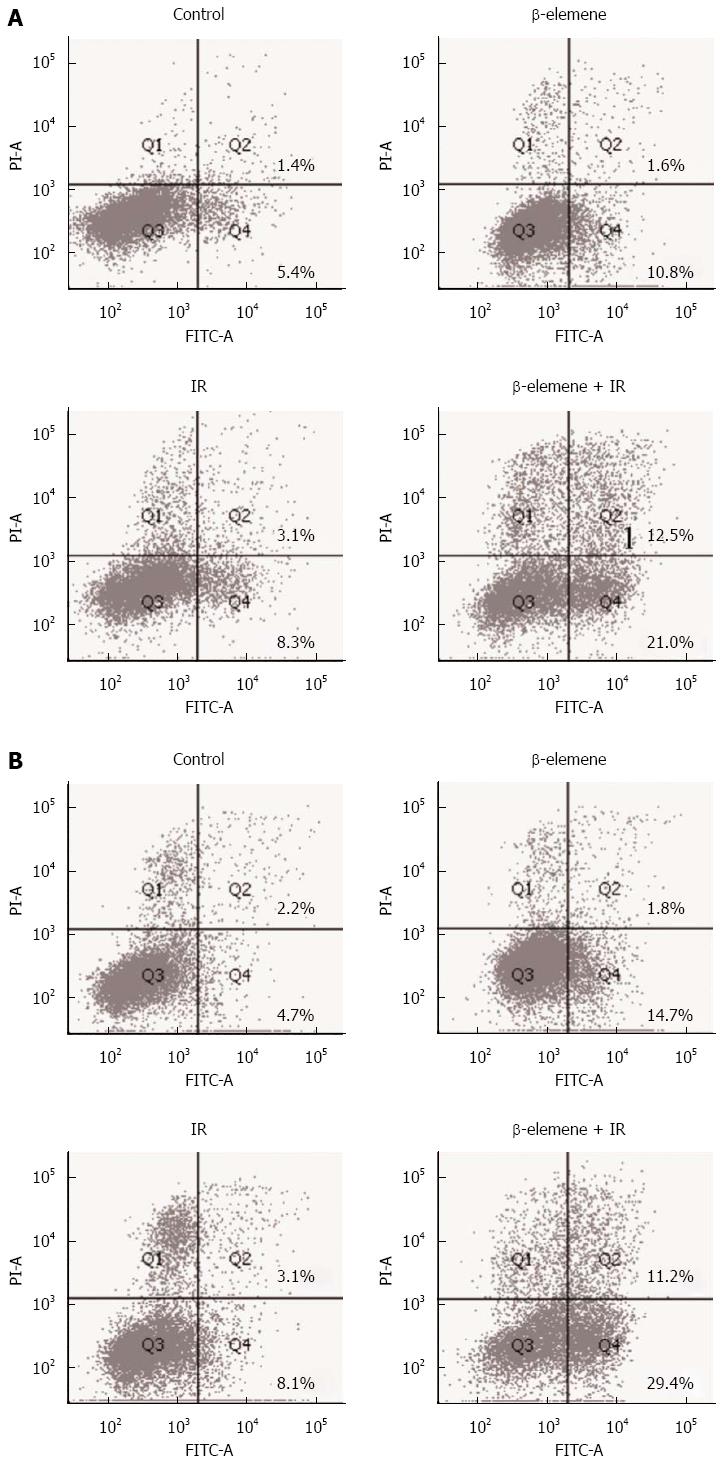
Figure 3 β-elemene pretreatment increased radiation-induced cell death in gastric cancer cells.
Cells were seeded into 6-well plates, incubated overnight, and exposed to the indicated concentration of β-elemene pretreatment prior to IR. 24 h after 8 Gy IR, cells were collected, incubated with annexin V-FITC and PI, and analyzed using FCM. Examples of independent FCM results are shown. A: MKN45 cell line; B: SGC7901 cell line. FCM: Flow cytometry. PI: Propidium iodide; IR: Ionizing radiation.
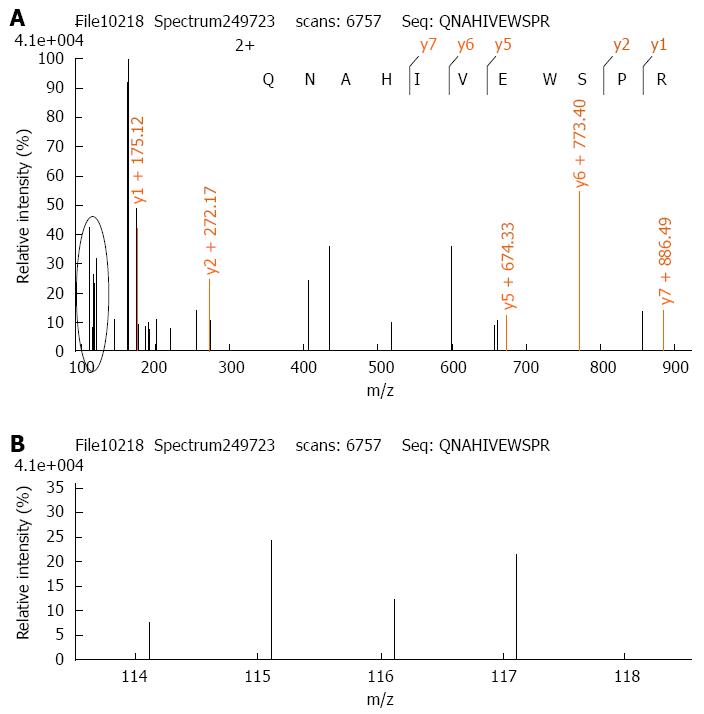
Figure 4 MS/MS spectrum showing the peptides from PAK1IP1 (peptide sequence: QNAHIVEWSPR) (A) and relative quantification of PAK1IP1 expression in the indicated conditions (B).
Different protein samples from SGC7901 cells labeled with iTRAQ reagents as follows: control-114 tag, β-elemene treated-115 tag, IR-116 tag, β-elemene combined with IR-117 tag. The relative intensity indicates the relative abundance of PAK1IP1 expression in different conditions.
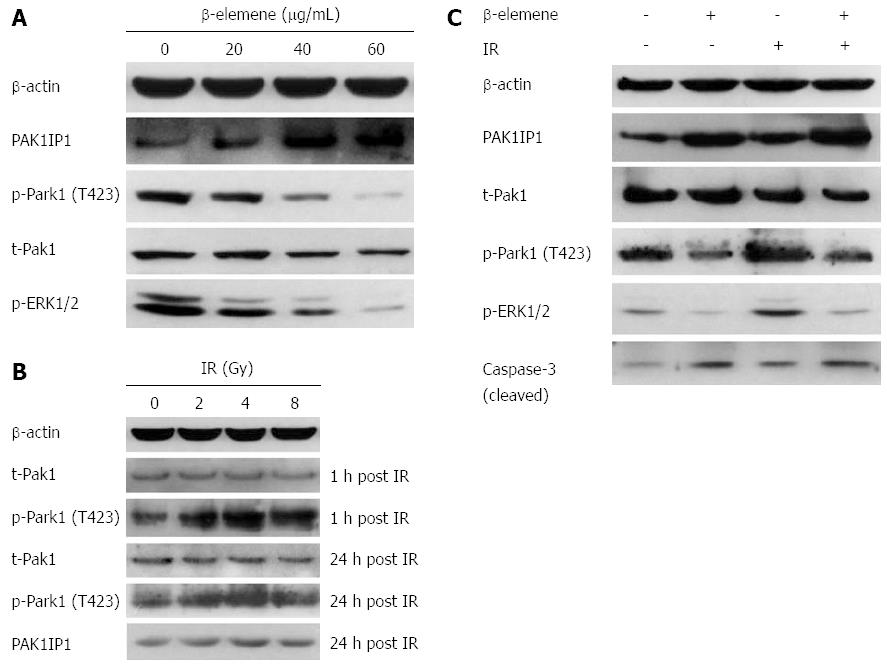
Figure 5 Protein expression in cells exposed to β-elemene, IR, and β-elemene plus IR examined by western blotting.
A: Validation of PAK1IP1 expression and the examination of phospho-Pak1 in response to β-elemene treatment, using β-actin as a loading control. β-elemene upregulated PAK1IP1, and downregulates phospho-Pak1 (T423) and its downstream p-ERK1/2; B: Ionizing radiation upregulated phospho-Pak1 (T423), but not total Pak1; C: β-elemene pretreatment decreased IR-induced upregulation of phospho-Pak1 (T423) and phospho-ERK1/2. The level of cleaved caspase-3 was consistent with the level of apoptosis at the cytological level (Figure 3B). IR: Ionizing radiation.
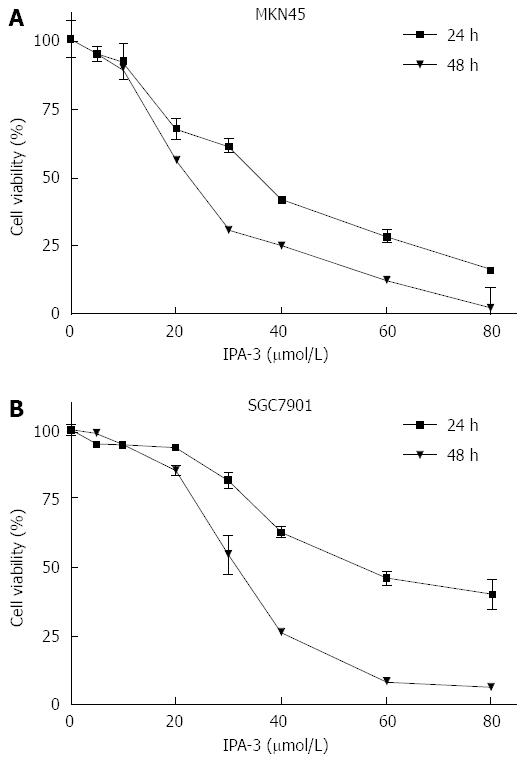
Figure 6 IPA-3 inhibits the viability of gastric cancer cells.
MKN45 (A) and SGC7901 (B) gastric cancer cells were treated with different concentrations of IPA-3 for 24 or 48 h. Cell viability was determined using the MTT assay. Dots and bars: mean ± SD.
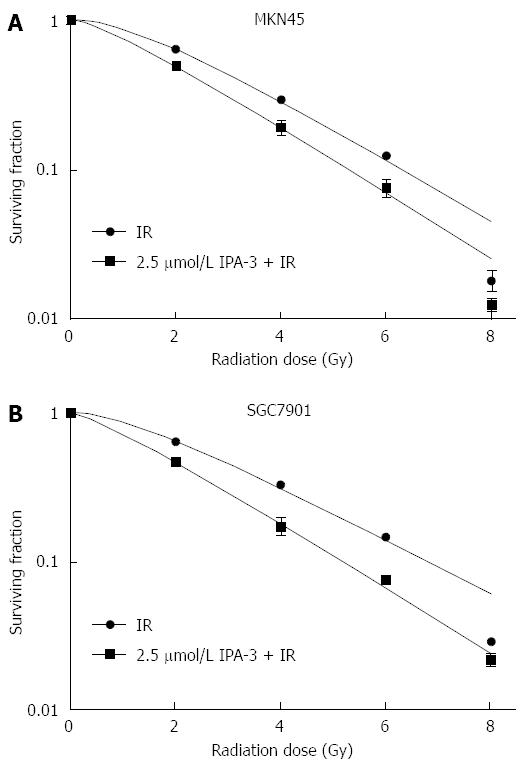
Figure 7 IPA-3 pretreatment decreases clonogenic survival following IR in gastric cancer cells.
Cells were seeded into 6-well plates as indicated. After 4 to 6 h attachment, cells were treated with or without the indicated concentrations of IPA-3 for 18 h, followed by exposure to the indicated doses of IR. Then, cells were incubated as described above and colonies were counted. Cell survival curves were fitted using Graphpad Prism 5.1 software according to the multi-target single hit model. A: MKN45 cell line; B: SGC7901 cell line. Dots and bars: mean ± SD.
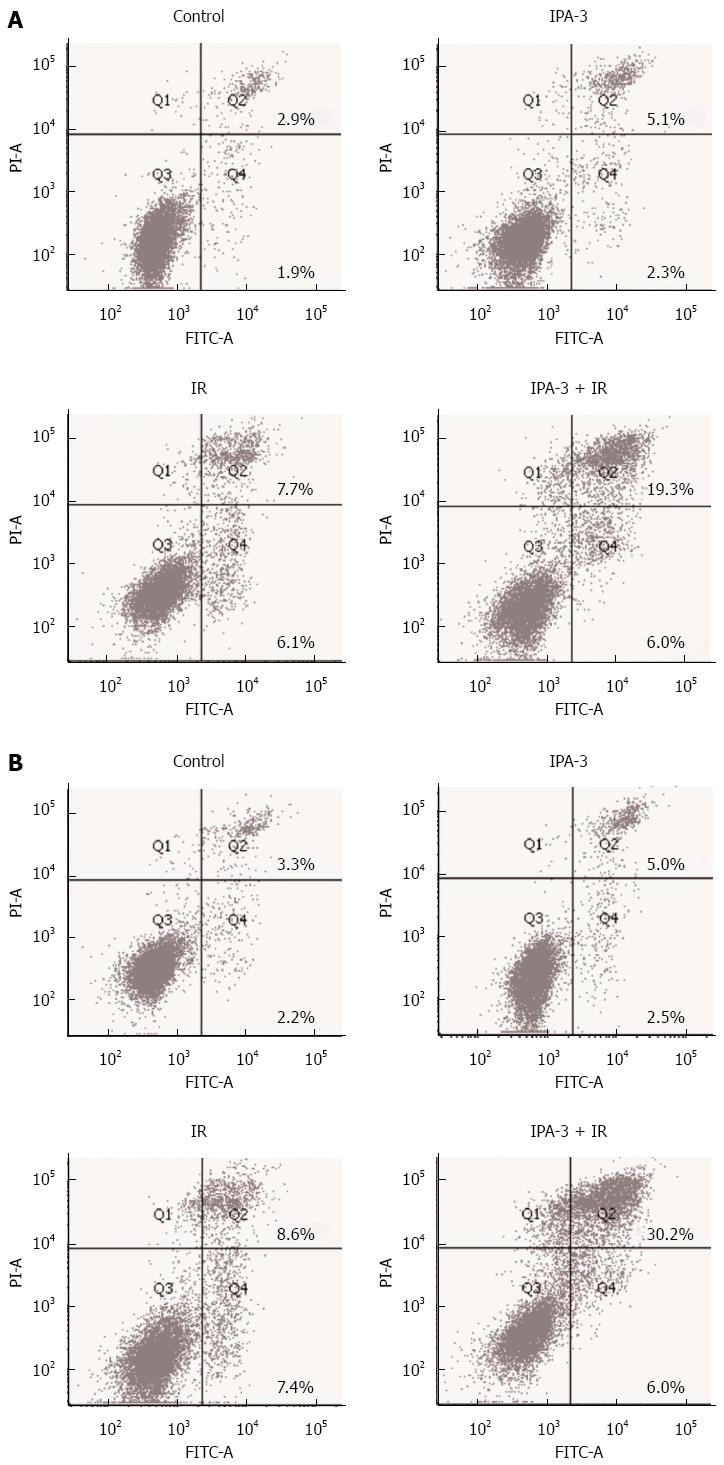
Figure 8 IPA-3 pretreatment increased radiation-induced cell death in gastric cancer cells.
Cells were seeded into 6-well plates and exposed to the indicated concentrations of IPA-3 pretreatment. 24 h after 8 Gy IR, cells were collected, incubated with annexin V-FITC and PI, and analyzed using FCM. The experiment was performed in triplicate. Representative FCM results are shown. A: MKN45 cell line; B: SGC7901 cell line. PI: Propidium iodide; IR: Ionizing radiation; FCM: Flow cytometry.
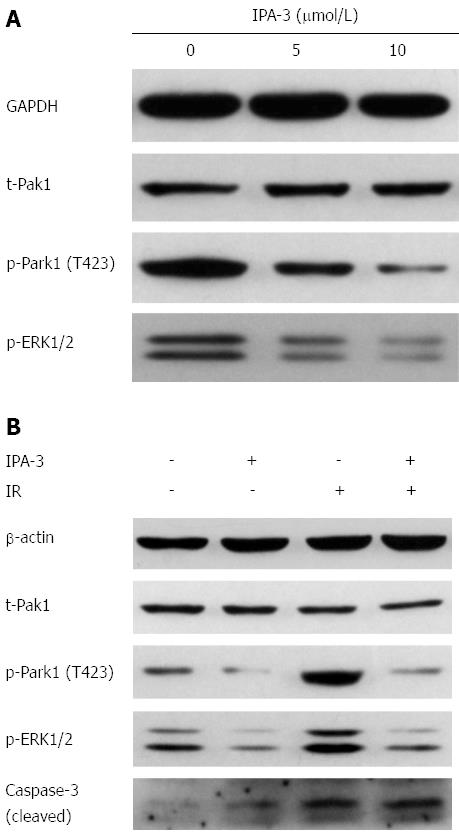
Figure 9 Protein expression of cells exposed to IPA-3 and IPA-3 plus IR examined by western blotting.
A: Validation of phospho-Pak1 downregulation in response to IPA-3 treatment, using GAPDH as a loading control. IPA-3 downregulated phospho-Pak1 (T423) and its downstream p-ERK1/2; B: IPA-3 pretreatment decreased IR-induced upregulation of phospho-Pak1 (T423) and phospho-ERK1/2. The level of cleaved caspase-3 was consistent with the level of apoptosis at the cytological level (Figure 8B).
- Citation: Liu JS, Che XM, Chang S, Qiu GL, He SC, Fan L, Zhao W, Zhang ZL, Wang SF. β-elemene enhances the radiosensitivity of gastric cancer cells by inhibiting Pak1 activation. World J Gastroenterol 2015; 21(34): 9945-9956
- URL: https://www.wjgnet.com/1007-9327/full/v21/i34/9945.htm
- DOI: https://dx.doi.org/10.3748/wjg.v21.i34.9945


