Copyright
©The Author(s) 2015.
World J Gastroenterol. Sep 14, 2015; 21(34): 9900-9915
Published online Sep 14, 2015. doi: 10.3748/wjg.v21.i34.9900
Published online Sep 14, 2015. doi: 10.3748/wjg.v21.i34.9900
Figure 1 Pressure results in the activation of hepatic stellate cells and regulates miR-9a-5p and Sirt1.
A: Immunofluorescence staining for α-SMA and desmin in fully activated hepatic stellate cells (HSCs); B: qRT-PCR confirms the result of miRNA expression profile. aP < 0.05 vs control; C: qRT-PCR and Western blot analyses of α-SMA and Col1 upon pressure overload. aP < 0.05 vs control; D: qRT-PCR and Western blot analyses of Sirt1 upon pressure overload (n = 3). bP < 0.01 vs control; E: Results of HE staining: (1) normal liver; (2) fibrotic liver. Immunohistochemistry experiments were used to identify Sirt1 expression in liver tissue; (3) normal liver; and (4) fibrotic liver; F: RNA was harvested from normal (n =10) and fibrotic (n =10) liver tissue. qRT-PCR was used to detect the expression of miR-9a-5p and Sirt1. aP < 0.05, bP < 0.01 vs control. qRT-PCR: Real-time quantitative polymerase chain reaction.
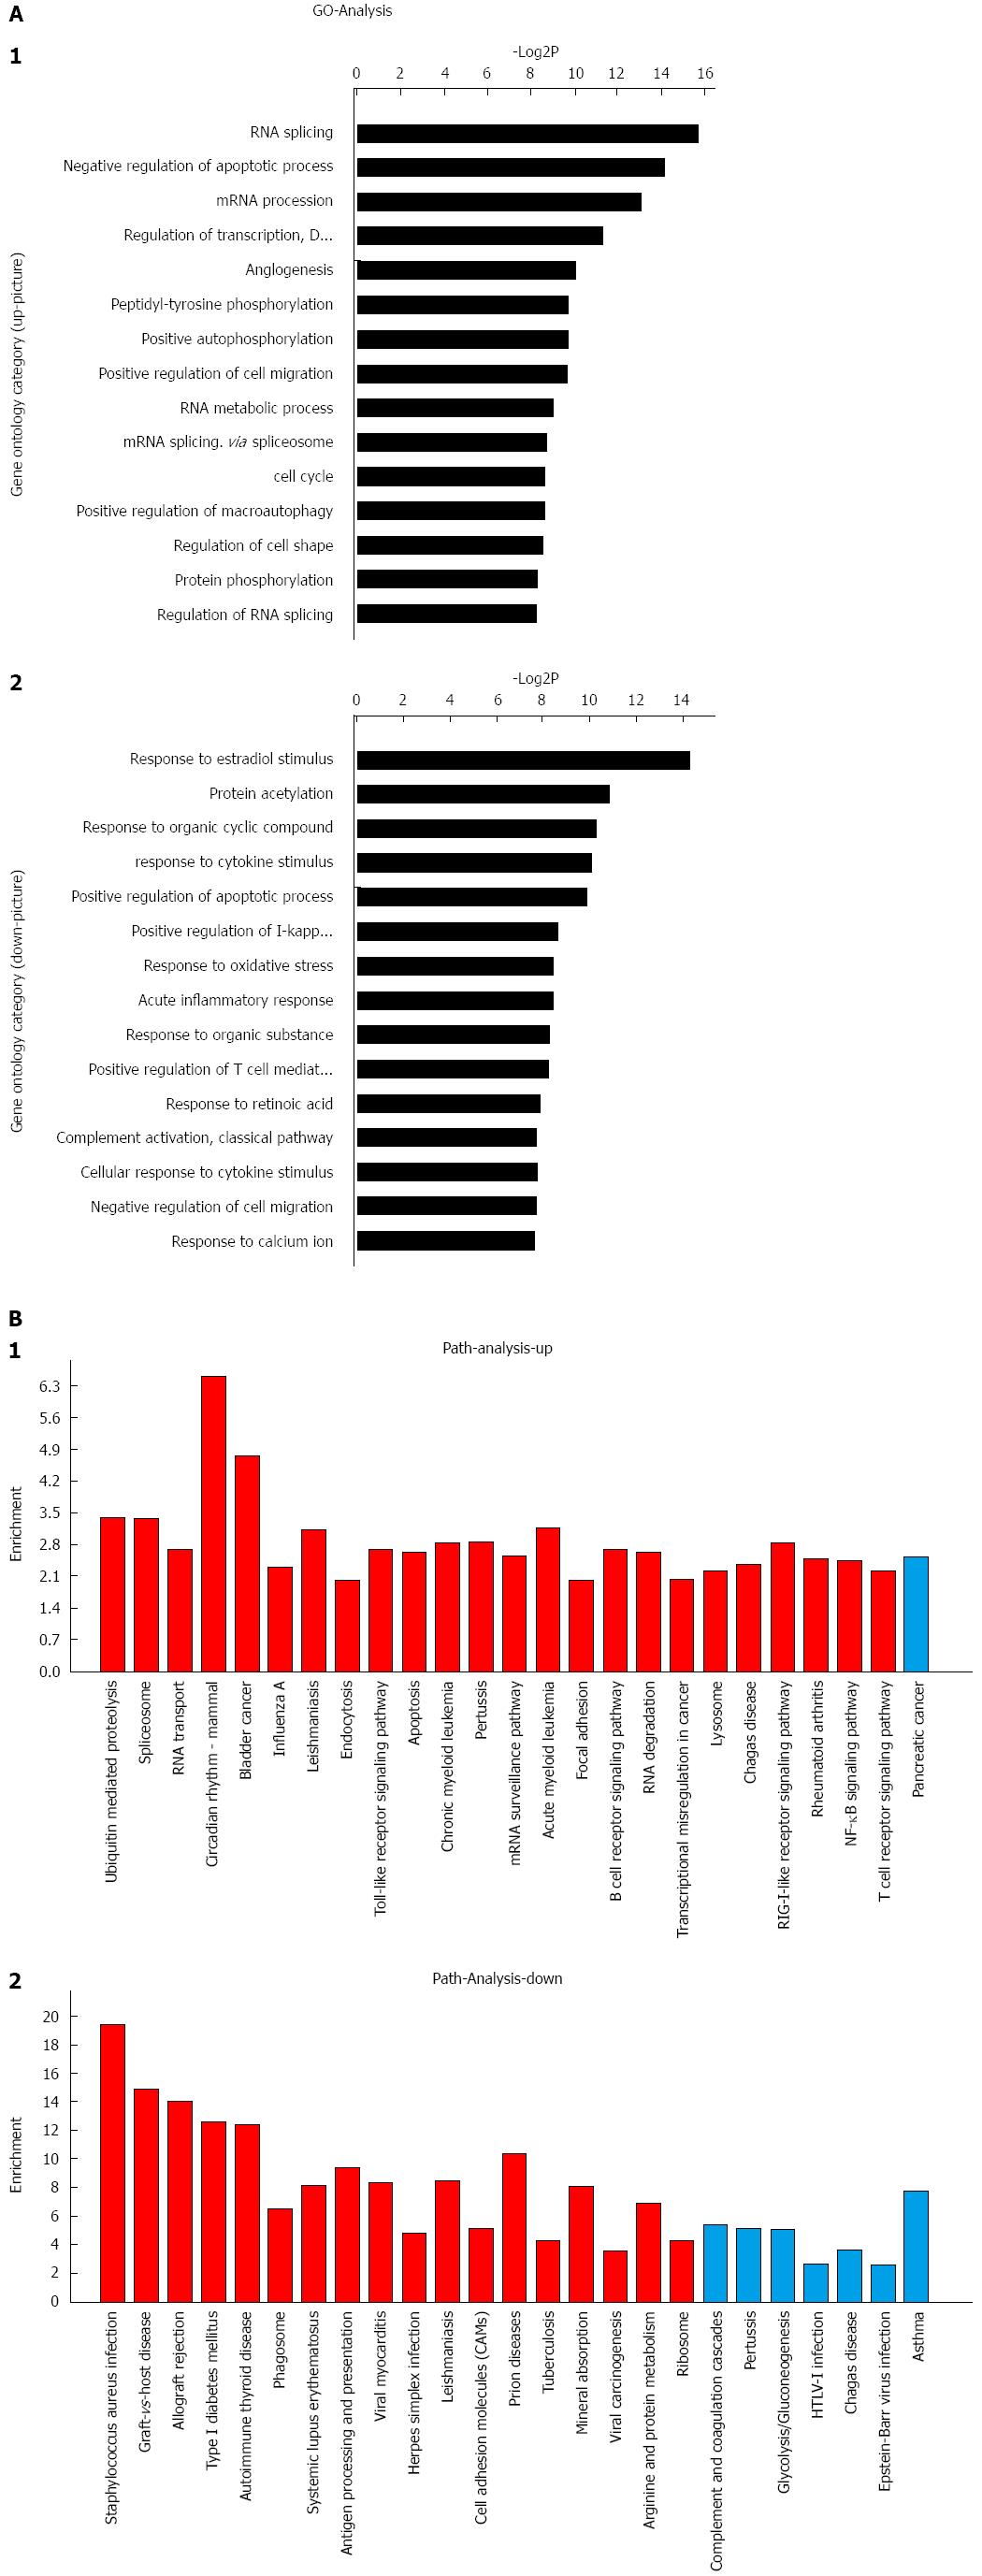
Figure 2 GO analysis and pathway analysis based on miRNA expression profiles.
A: Significant GOs targeted by upregulated miRNAs (1) and significant GOs targeted by downregulated miRNAs (2). The vertical axis is the GO category, and the horizontal axis is the enrichment of GOs; B: Significant pathways controlled by upregulated miRNAs (1) and significant pathways controlled by downregulated miRNAs (2). The horizontal axis is the pathway category, and the vertical axis is the enrichment of the pathway. GO: Gene ontology; NF-κB: Nuclear factor-kappa B.
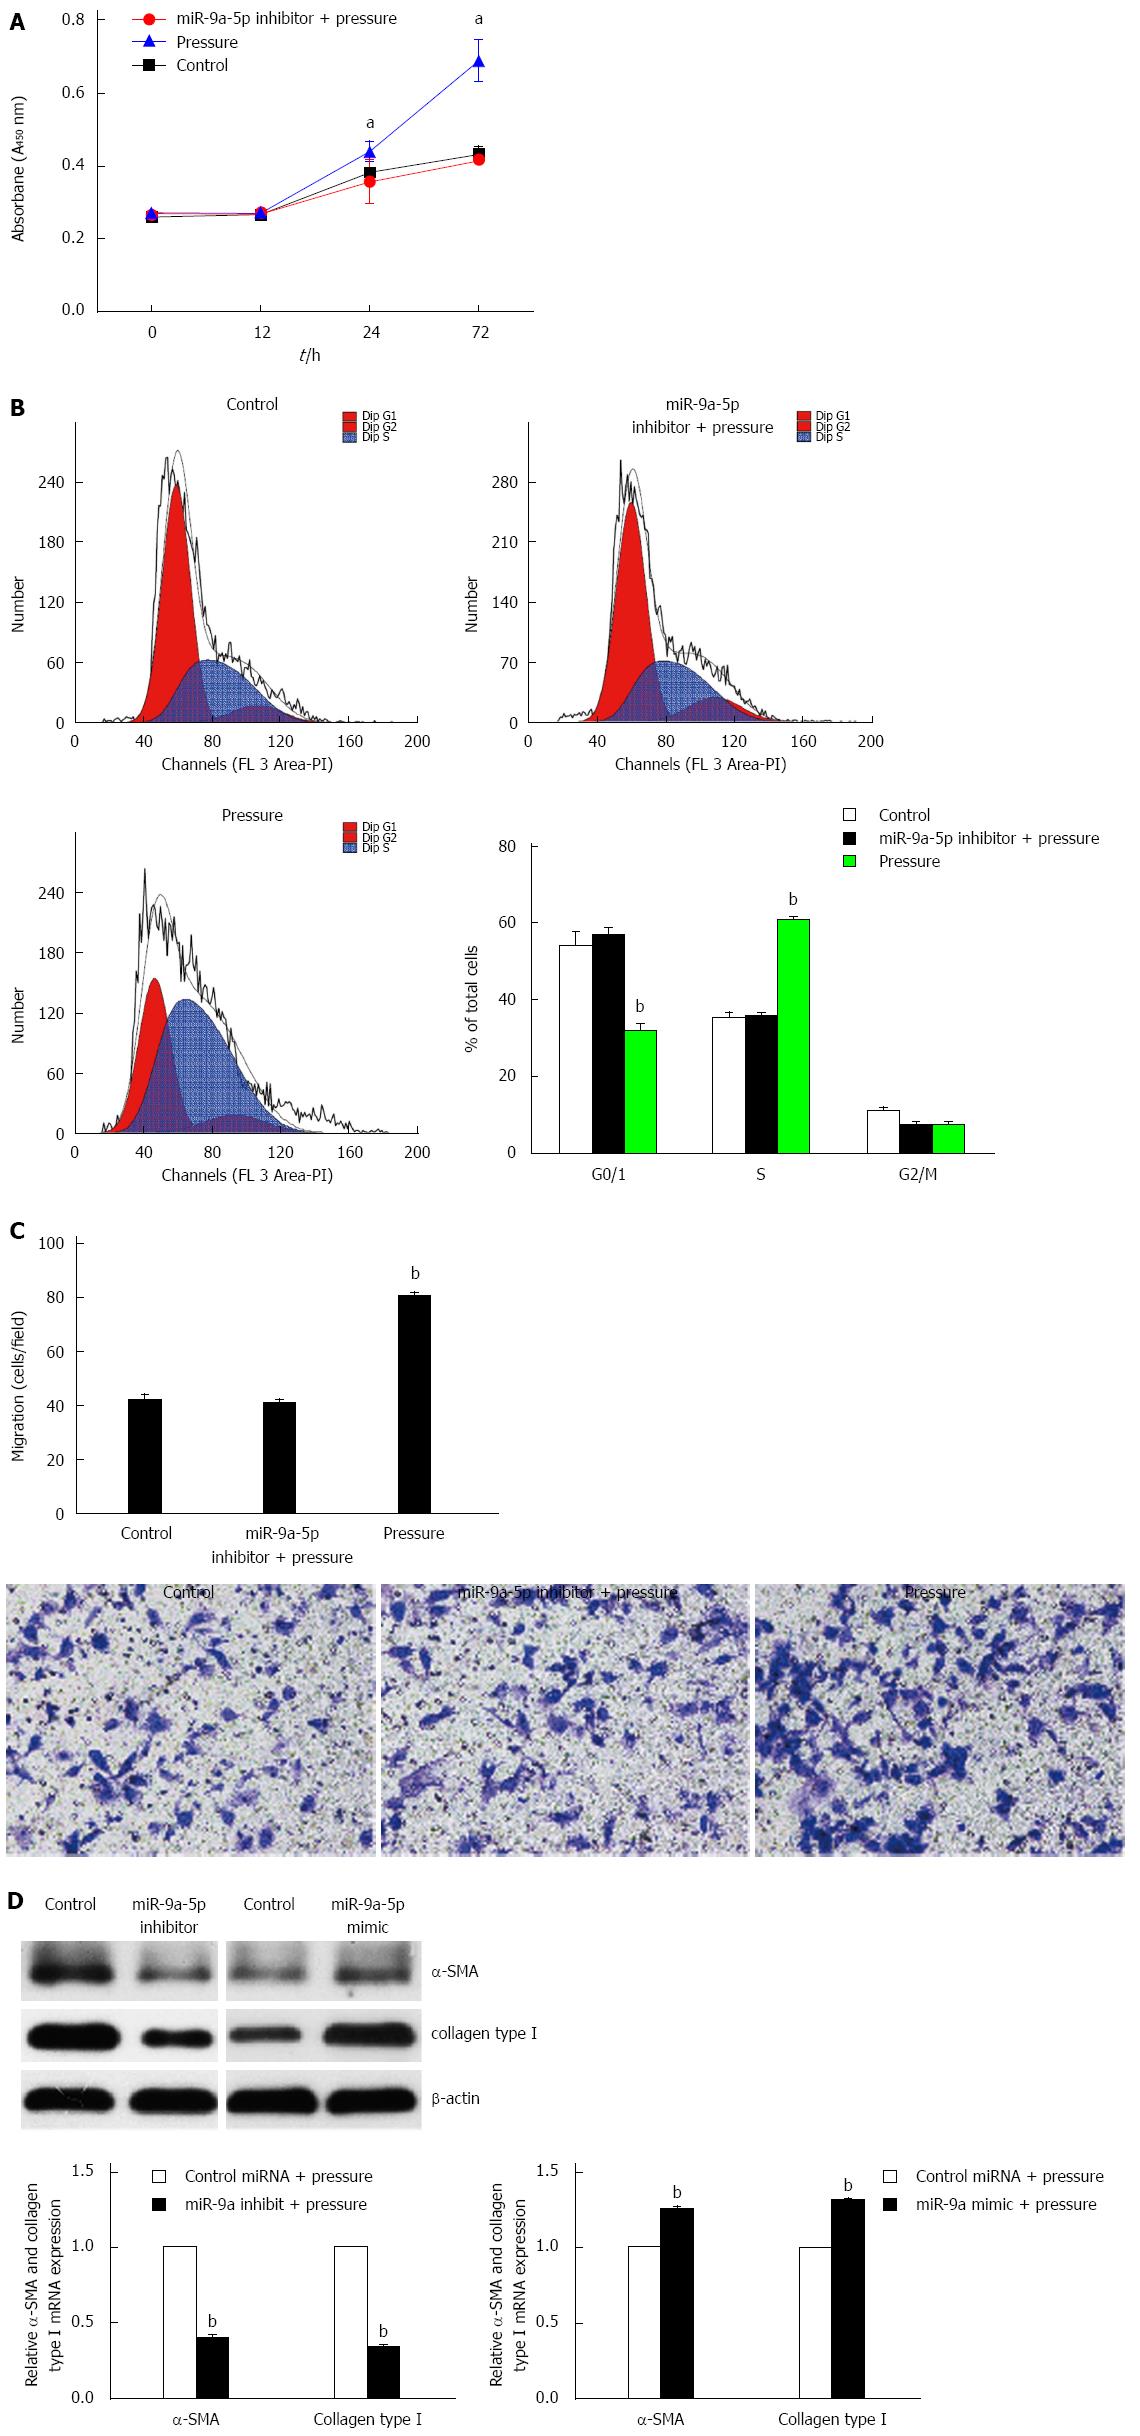
Figure 3 MiR-9a-5p regulates the proliferation, migration and activation of hepatic stellate cells under pressure overload.
A: Hepatic stellate cells (HSCs) transfected with a miR-9a-5p inhibitor or a negative control were exposed to increased pressure. Then, the cells were seeded in 96-well plates, cultured for 72 h and observed with a microplate reader at 0 , 12, 24 and 72 h. aP < 0.05 vs control; B: The cell cycle analysis of each group was conducted by FACS. bP < 0.01 vs control; C: Down-regulation of miR-9a-5p inhibits HSC migration by about 40% assessed by Transwell assay. bP < 0.01 vs control; D: The mRNA and protein levels of α-SMA and Col1 were decreased by a miR-9a-5p inhibitor, and were increased by a miR-9a-5p mimic. Data are shown as the mean ± SD. Triplicate assays were performed and bP < 0.01 vs control.
Figure 4 MiR-9a-5p suppresses the proliferation, migration and activation of hepatic stellate cells by directly binding to Sirt1 3’-UTR region.
A: Alignment of miR-9a-5p with the target sequence in the WT 3’-UTR of Sirt1 and the site-directed mutant 3’-UTR of Sirt1 (using Target Scan). The effect of co-transfection with pmir-Report, pmir-Report Sirt1 3’-UTR (wild-type or mutant) on luciferase activity was assessed in HEK293T cells. Student’s t-test was used for statistical analysis (n = 3; bP < 0.01 vs control); B and C: qRT-PCR and Western blot analyses of Sirt1 levels in hepatic stellate cells (HSCs) under the treatment of a miR-9a-5p mimic or a miR-9a-5p inhibitor and their corresponding negative controls (n = 3; aP < 0.05, bP < 0.01 vs control); D: HSCs transfected with Sirt1 or a negative control were exposed to increased pressure. Then, the cells were seeded in 96-well plates, cultured for 72 h and observed with a microplate reader at 0, 12, 24 and 72 h. aP < 0.05 vs control; E: The cell cycle analysis of each group was conducted by FACS; F: qRT-PCR was used to detect the expression of α-SMA and Col1 after up-regulation of Sirt1. Data are presented as the mean ± SD. bP < 0.01 vs control; G: Overexpression of miR-9a-5p and Sirt1 inhibits HSC migration by about 30 % assessed by Transwell assay. bP < 0.01 vs control. qRT-PCR: Real-time quantitative polymerase chain reaction; UTR: Untranslated region; HSC: Hepatic stellate cell.
- Citation: Qi F, Hu JF, Liu BH, Wu CQ, Yu HY, Yao DK, Zhu L. MiR-9a-5p regulates proliferation and migration of hepatic stellate cells under pressure through inhibition of Sirt1. World J Gastroenterol 2015; 21(34): 9900-9915
- URL: https://www.wjgnet.com/1007-9327/full/v21/i34/9900.htm
- DOI: https://dx.doi.org/10.3748/wjg.v21.i34.9900


