Copyright
©The Author(s) 2015.
World J Gastroenterol. Sep 14, 2015; 21(34): 10018-10024
Published online Sep 14, 2015. doi: 10.3748/wjg.v21.i34.10018
Published online Sep 14, 2015. doi: 10.3748/wjg.v21.i34.10018
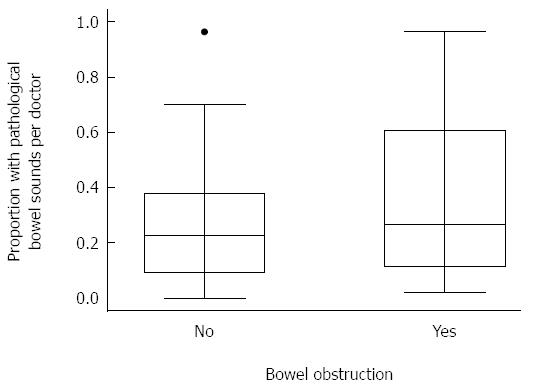
Figure 1 Box plot showing distributions of the proportion of patients with pathological bowel sounds per doctor in 37 patients with bowel obstruction and 61 patients with no obstruction.
Each doctor contributes one proportion to each column.
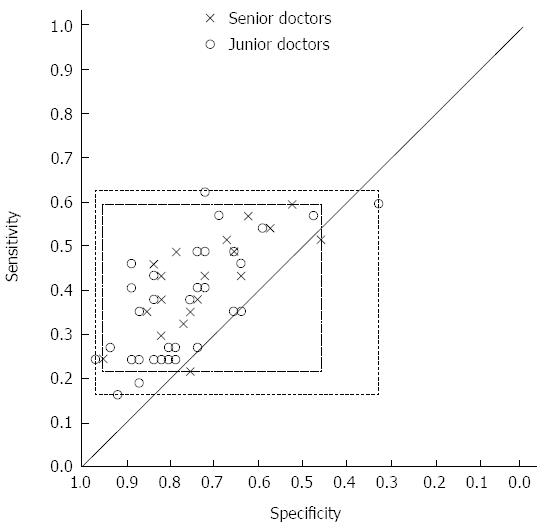
Figure 2 Receiver operator characteristics diagram with estimates of sensitivity and specificity for each of the 52 doctors stratified according to clinical experience.
The boxes show the range of values for sensitivity and specificity for junior and senior doctors. The diagram contains 51 visible pairs of sensitivity and specificity since pairs of estimates were identical for two junior doctors and for two senior doctors.
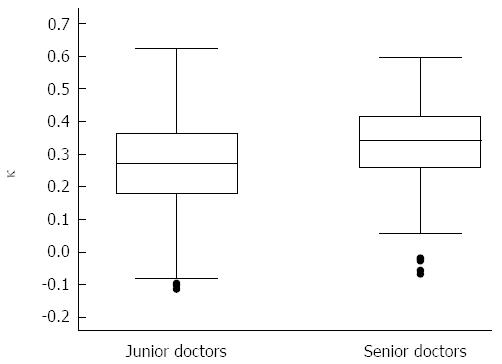
Figure 3 Boxplot summarizing the distributions of κ values in 528 pairs of junior doctors and in 190 pairs of senior doctors.
- Citation: Breum BM, Rud B, Kirkegaard T, Nordentoft T. Accuracy of abdominal auscultation for bowel obstruction. World J Gastroenterol 2015; 21(34): 10018-10024
- URL: https://www.wjgnet.com/1007-9327/full/v21/i34/10018.htm
- DOI: https://dx.doi.org/10.3748/wjg.v21.i34.10018


