Copyright
©The Author(s) 2015.
World J Gastroenterol. Sep 14, 2015; 21(34): 10008-10017
Published online Sep 14, 2015. doi: 10.3748/wjg.v21.i34.10008
Published online Sep 14, 2015. doi: 10.3748/wjg.v21.i34.10008
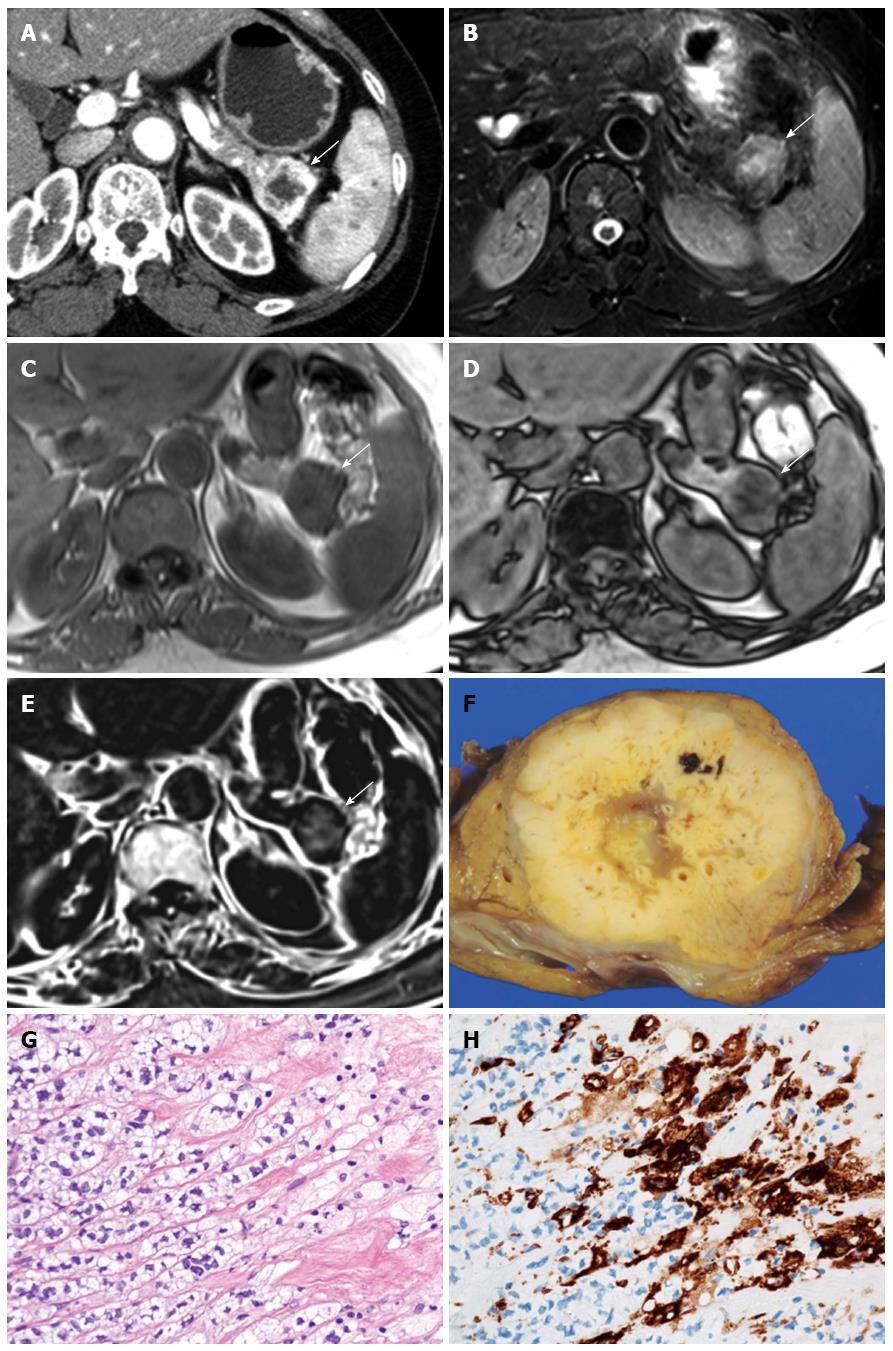
Figure 1 Lipid-rich pancreatic neuroendocrine tumor in a 64-year-old woman.
A: Axial early phase enhanced computed tomography shows a 30 mm well-circumscribed tumor (arrow) with thick and marked contrast enhancement only at the periphery; B: The tumor shows heterogeneous high signal intensity (arrow) on fat-suppressed T2-weighted images (4200/71); C and D: In-phase (5.8/2.4, 10°) (C) and out-of-phase (5.8/1.2, 10°) images with 3D technique (D) show a substantial drop in tumor signal intensity (arrow) from the in-phase (209.6) to the out-of-phase (137.5) image, resulting in a signal intensity index of 34.4%; E: The subtraction image shows apparent high signal intensity (arrow), indicating the presence of lipid component; F: Grossly, the pancreatic NET is a well-circumscribed yellowish color lesion; G: Microscopically, the tumor cells have abundant microvesicular cytoplasm; H: Adipose differentiation-related protein (ADRP) is expressed in the cytoplasm of tumor cells. The staining area is a microvesicular pattern as droplets.
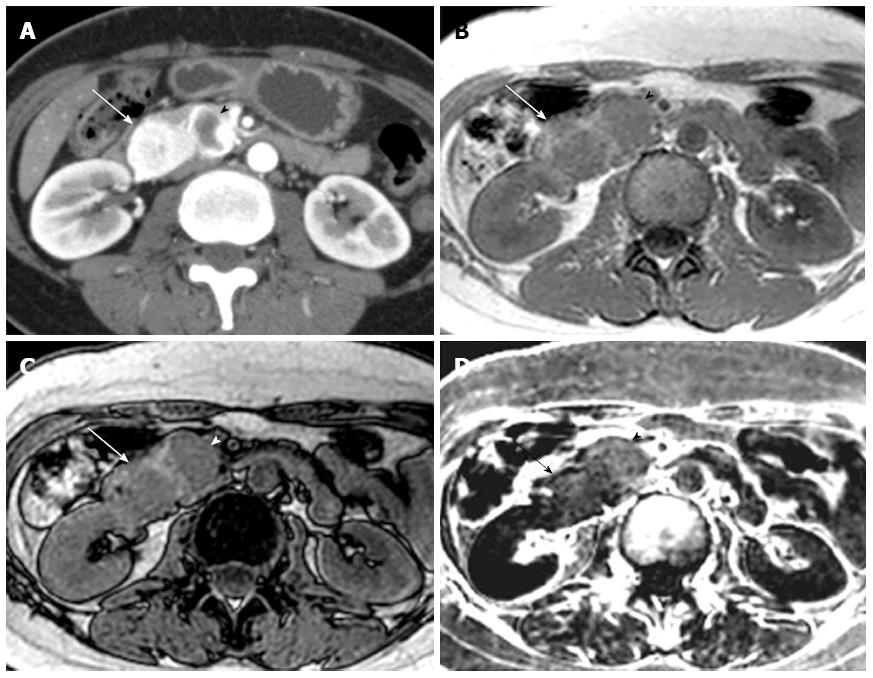
Figure 2 Lipid-rich pancreatic neuroendocrine tumors in a 49-year-old woman with von-Hippel-Lindau disease.
A: Axial early phase enhanced computed tomography shows a 30 mm tumor with homogenous enhancement (arrow) and a 24 mm tumor with marked peripheral enhancement (arrow head) in the head of the pancreas; B and C: In-phase (134/2.4, 60°) (B) and out-of-phase (134/1.2, 60°) images with 2D technique (C) show a substantial drop in tumor signal intensity from the in-phase [813.0 (arrow) and 819.5 (arrow head)] to the out-of-phase [783.2 (arrow) and 775.3 (arrow head)] image, resulting in signal intensity indexes of 3.7% (arrow) and 5.4% (arrow head), respectively; D: The subtraction image shows apparent high signal intensity (arrow and arrow head).
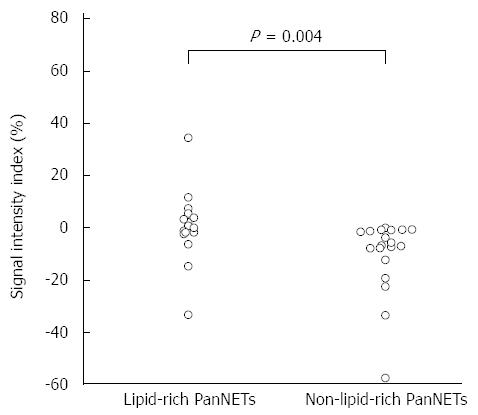
Figure 3 Scatterplot showing the differences in signal intensity index between lipid-rich and non-lipid-rich pancreatic neuroendocrine tumors.
Eight of 15 lipid-rich pancreatic neuroendocrine tumors (PanNETs) exhibit positive signal intensity index values, whereas 0 of 19 non-lipid-rich PanNETs show positive values. The signal intensity index is significantly higher in lipid-rich than in non-lipid-rich PanNETs (P = 0.004).
- Citation: Fukukura Y, Shindo T, Higashi M, Takumi K, Umanodan T, Yoneyama T, Yoshiura T. Computed tomography and magnetic resonance imaging features of lipid-rich neuroendocrine tumors of the pancreas. World J Gastroenterol 2015; 21(34): 10008-10017
- URL: https://www.wjgnet.com/1007-9327/full/v21/i34/10008.htm
- DOI: https://dx.doi.org/10.3748/wjg.v21.i34.10008


