Copyright
©The Author(s) 2015.
World J Gastroenterol. Aug 28, 2015; 21(32): 9623-9629
Published online Aug 28, 2015. doi: 10.3748/wjg.v21.i32.9623
Published online Aug 28, 2015. doi: 10.3748/wjg.v21.i32.9623
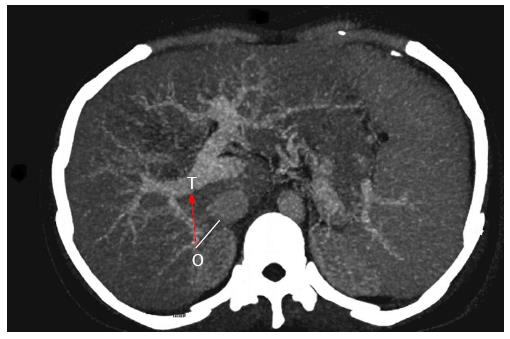
Figure 1 Axial distance between puncture point of origin (o) and target point (t) of the portal vein.
Point of origin (o) is located about 1.5 cm (white line) from the confluence of the right hepatic vein to inferior vena cava, and the red arrow between the two points is the anterior-posterior distance of the puncture.
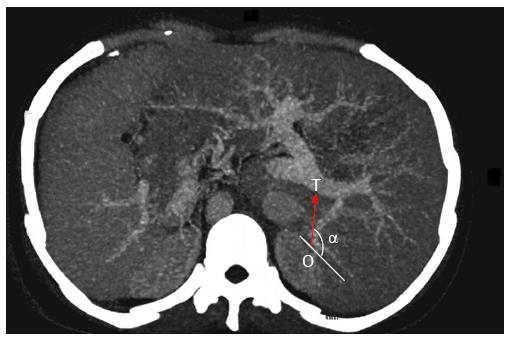
Figure 2 Determination of rotation angle for puncture set.
Contrast-enhanced computed tomography image in Figure 1 is rotated 180 degrees, and the angle between the direction given by the extension line that links the two puncture points and direction of the right vein (red arrow) is the rotation angle (α) for the puncture set.
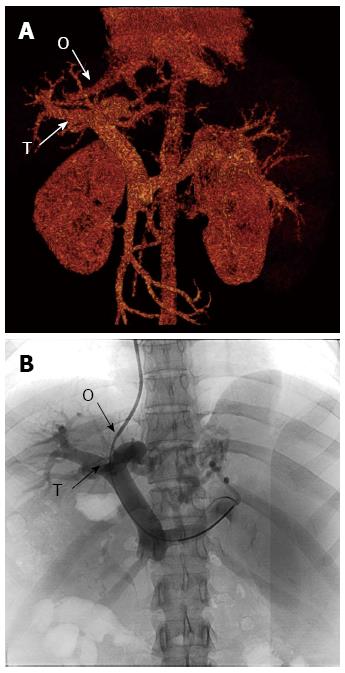
Figure 3 Comparison of preoperative three-dimensional reconstructed image of the portal vein system and direct portogram obtained with non-iodinated contrast medium (Iopamiro 370) after a successful portal vein puncture.
A: Preoperative three-dimensional reconstructed vascular image; B: Direct portogram of the portal vein (PV) during a successful puncture. O: Puncture point of the right hepatic vein; T: Target point of the right PV branch.
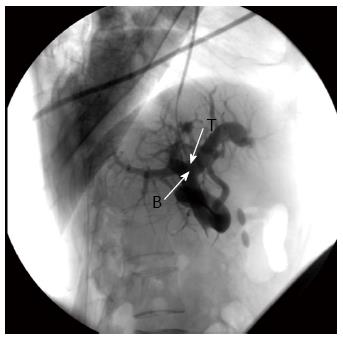
Figure 4 Portogram showing target point in transjugular intrahepatic portal systemic shunt puncture.
The points were distal to the image bifurcation (T: Target point of the portal vein; B: The bifurcation).
- Citation: Qin JP, Tang SH, Jiang MD, He QW, Chen HB, Yao X, Zeng WZ, Gu M. Contrast enhanced computed tomography and reconstruction of hepatic vascular system for transjugular intrahepatic portal systemic shunt puncture path planning. World J Gastroenterol 2015; 21(32): 9623-9629
- URL: https://www.wjgnet.com/1007-9327/full/v21/i32/9623.htm
- DOI: https://dx.doi.org/10.3748/wjg.v21.i32.9623


