Copyright
©The Author(s) 2015.
World J Gastroenterol. Jul 28, 2015; 21(28): 8588-8604
Published online Jul 28, 2015. doi: 10.3748/wjg.v21.i28.8588
Published online Jul 28, 2015. doi: 10.3748/wjg.v21.i28.8588
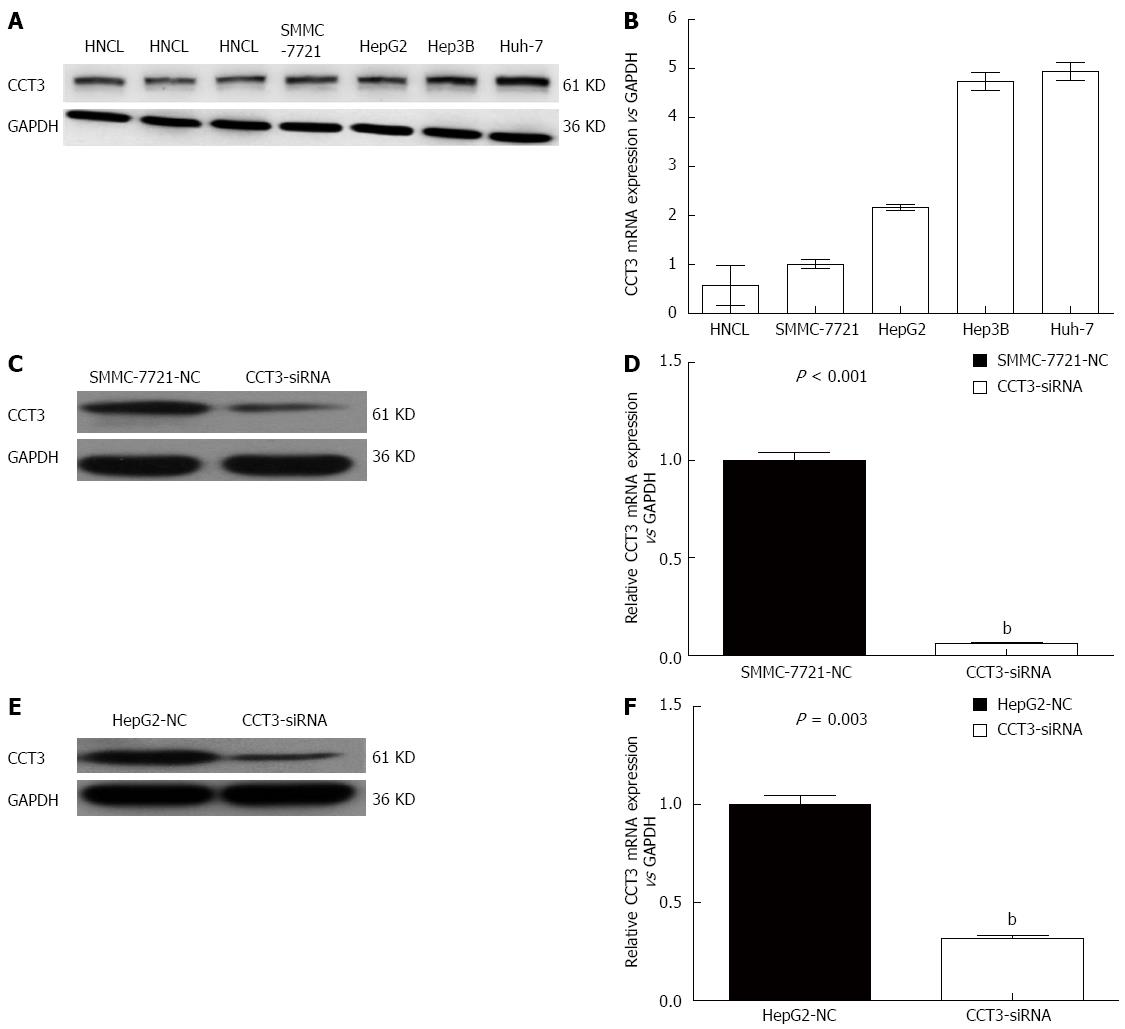
Figure 1 Expression of subunit 3 in tissues and cell lines.
A: Expression of the subunit 3 (CCT3) protein in human non-cancerous liver tissues (HNCL) obtained from patients with hepatic hemangioma and in hepatocellular carcinoma (HCC) cells by western blotting; B: Expression of CCT3 mRNA in HNCL and HCC cells; C-F: Effect of knocking down the expression of CCT3 by siRNA in the HCC cell lines SMMC-7721 and HepG2, as shown by western blotting and qPCR (bP < 0.01 vs negative control). NC: Negative control.
Figure 2 Knockdown of subunit 3 expression suppressed proliferation, apoptosis and invasion in hepatocellular carcinoma cell lines.
A: Knockdown of subunit 3 (CCT3) gene expression suppressed proliferation in hepatocellular carcinoma (HCC) cells, as assessed by the cellomics assay [aP < 0.05, bP < 0.01 vs negative control (NC)]; B: Proliferation was inhibited in the CCT3-siRNA group, as assessed by the MTT assay, absorbance was recorded at 490 nm (bP < 0.01 vs negative control); C: Suppression of CCT3 expression changed the G1, S, or G2/M level in HCC cells, as assessed by flow cytometry (aP < 0.05, bP < 0.01 vs negative control); D: Inhibiting CCT3 expression in HCC cells induced more apoptosis compared with the negative control (bP < 0.01 vs negative control); E: Invasion was markedly reduced in the CCT3-siRNA group (bP < 0.01 vs negative control).
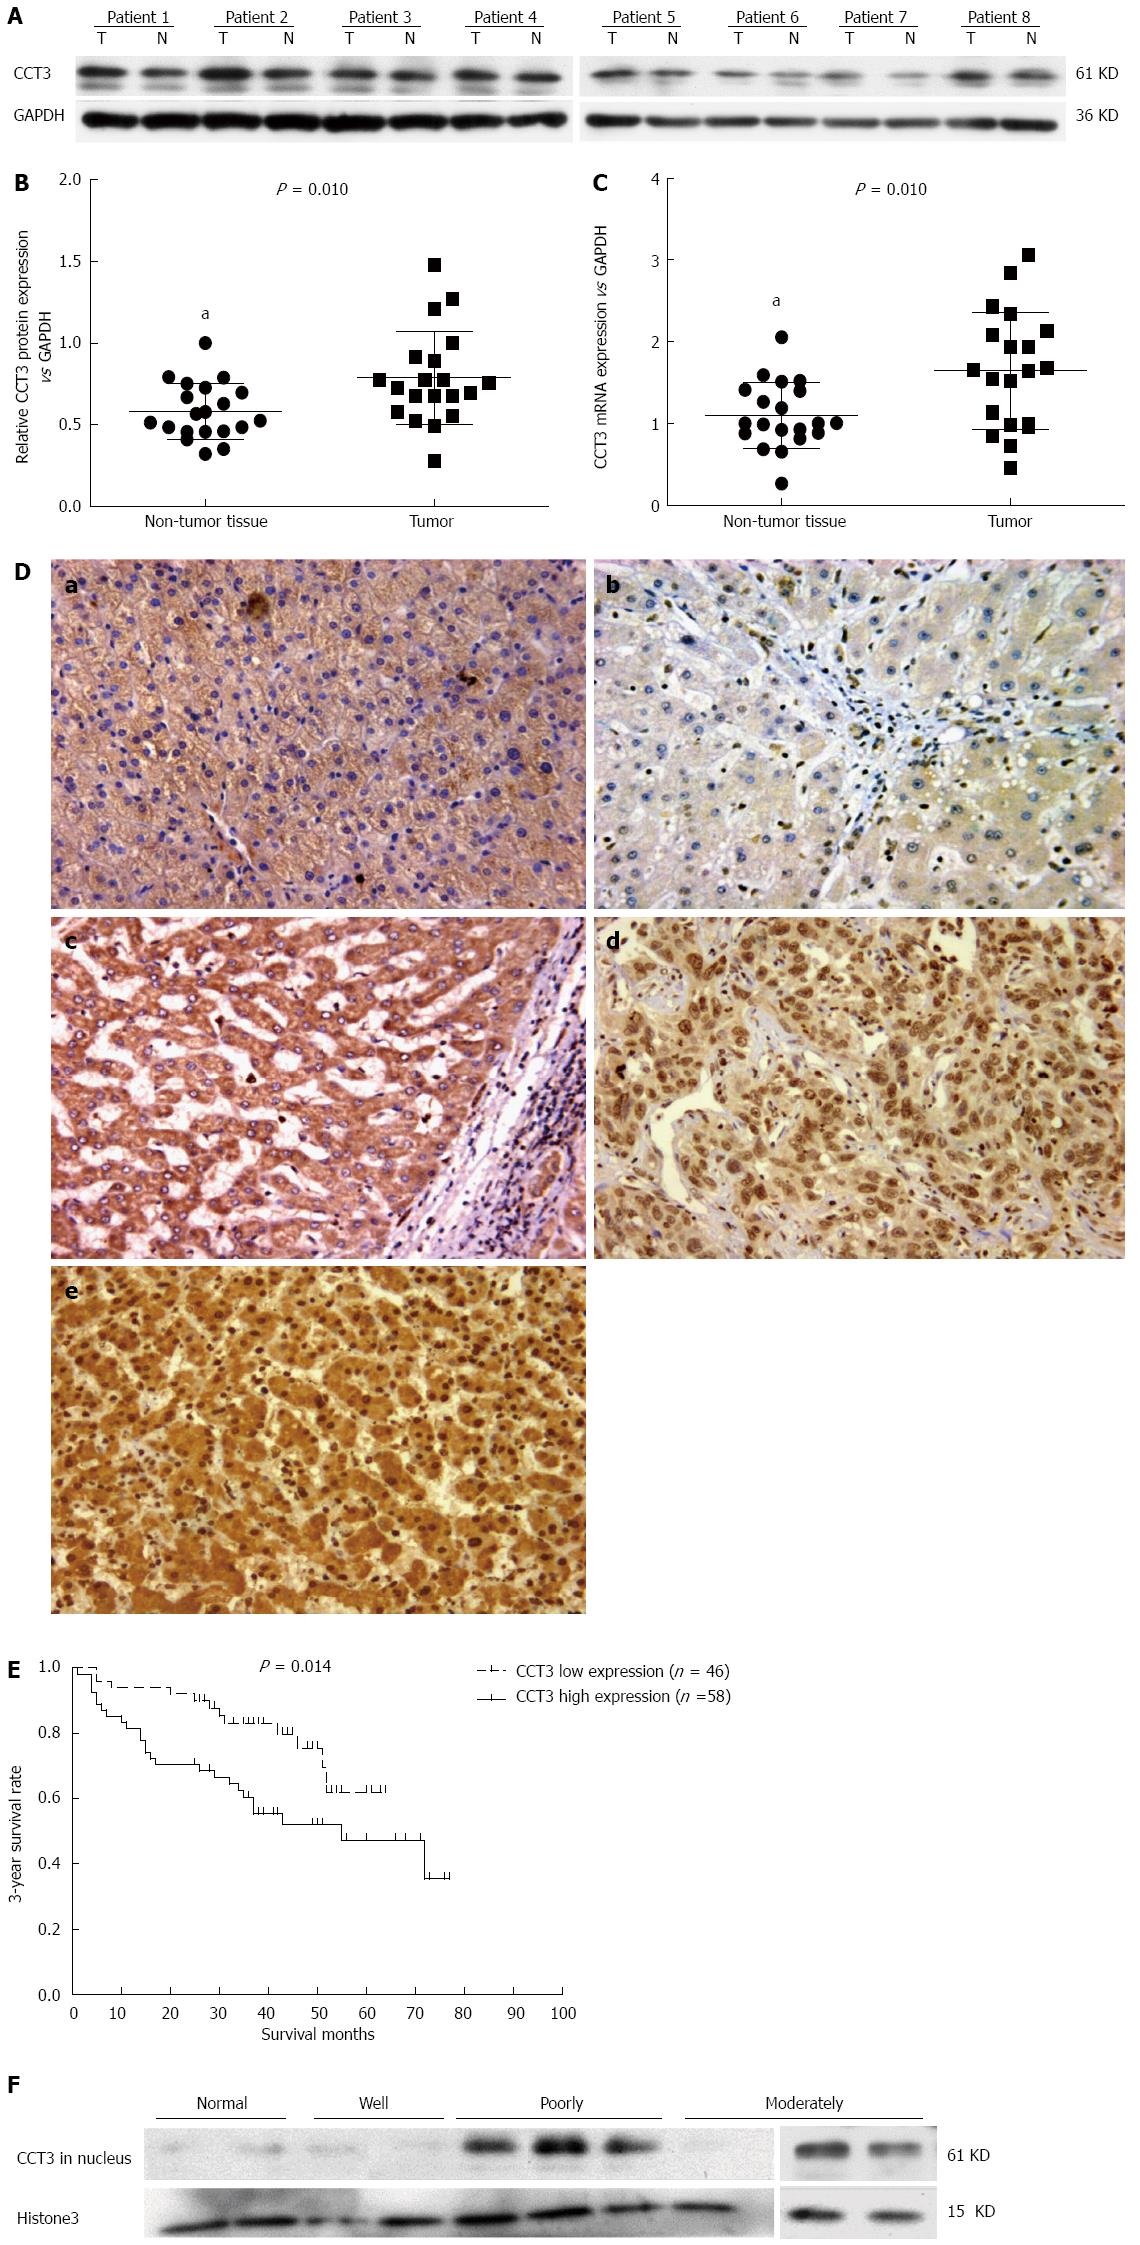
Figure 3 Subunit 3 expression in hepatocellular carcinoma specimens and its association with 3-year survival rate.
A-C: Expression of subunit 3 (CCT3) protein in hepatocellular carcinoma (HCC) tissues was higher than that in adjacent non-cancerous tissue, as shown by western blotting and qPCR (aP < 0.05 vs control); D: Expression of CCT3 in various differentiated HCC specimens and non-cancerous liver tissues from patients with hepatic hemangioma by immunohistochemistry (Original magnification × 200). a: Non-cancerous liver tissue from hepatic hemangioma patients (CCT3 positive expression in the cytoplasm and negative in the nuclei); b: Highly-differentiated HCC (negative in both the cytoplasm and nuclei); c: Moderately-differentiated HCC (positive in the cytoplasm and negative in nuclei); d: Poorly-differentiated HCC (negative in the cytoplasm and positive in nuclei); e: Poorly-differentiated HCC (positive in the cytoplasm and nuclei); E: Survival curves according to CCT3 expression. Patients with low expression of CCT3 in the nuclei of cancerous cells had higher cumulative survival rates than patients with high expression; F: Expression of CCT3 in the nuclei of well-, moderately-, and poorly-differentiated HCC specimens, and in non-cancerous liver tissues.
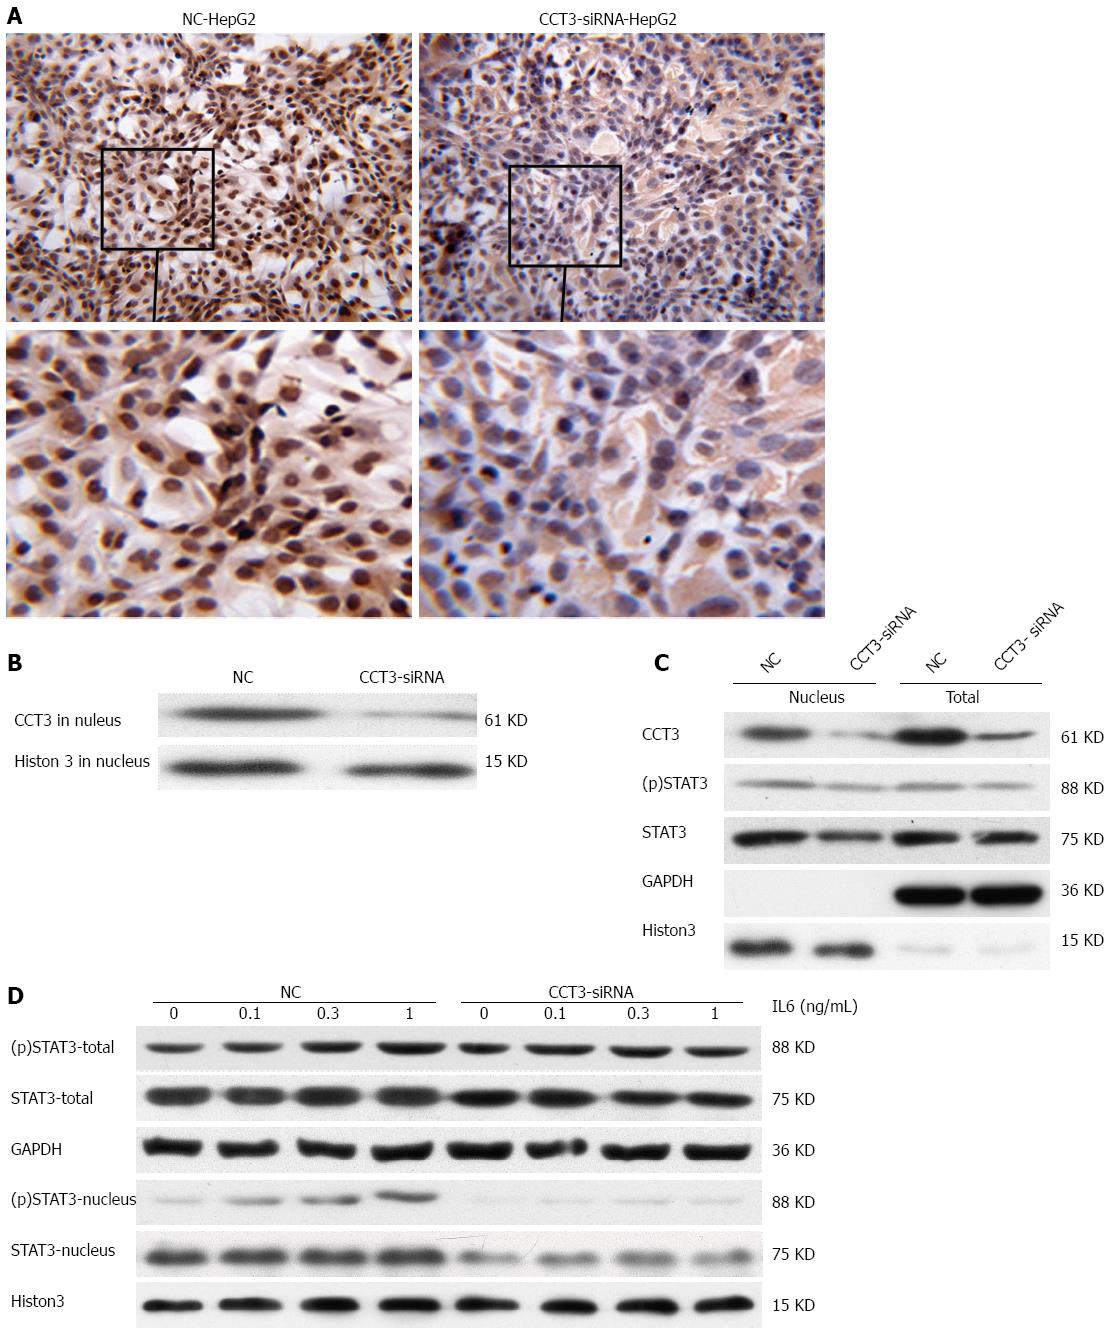
Figure 4 Expression of subunit 3 in HepG2 cells had an impact on the IL6/STAT3 signal pathway.
A, B: Staining of subunit 3 (CCT3) in nuclei of the CCT3-siRNA group was reduced compared with the negative control (NC) group, as shown by immunocytochemistry (ICC, original magnification × 200) and western blotting; C: Knockdown of CCT3 expression reduced the level of total STAT3 in HepG2 cells and (p)STAT3 in the nucleus; D: Stimulation with IL-6 which could decreased the level of STAT3 and (p)STAT3 proteins in the nuclei of cells in the CCT3-siRNA compared with the NC group.
- Citation: Cui X, Hu ZP, Li Z, Gao PJ, Zhu JY. Overexpression of chaperonin containing TCP1, subunit 3 predicts poor prognosis in hepatocellular carcinoma. World J Gastroenterol 2015; 21(28): 8588-8604
- URL: https://www.wjgnet.com/1007-9327/full/v21/i28/8588.htm
- DOI: https://dx.doi.org/10.3748/wjg.v21.i28.8588


