Copyright
©The Author(s) 2015.
World J Gastroenterol. Jul 21, 2015; 21(27): 8441-8451
Published online Jul 21, 2015. doi: 10.3748/wjg.v21.i27.8441
Published online Jul 21, 2015. doi: 10.3748/wjg.v21.i27.8441
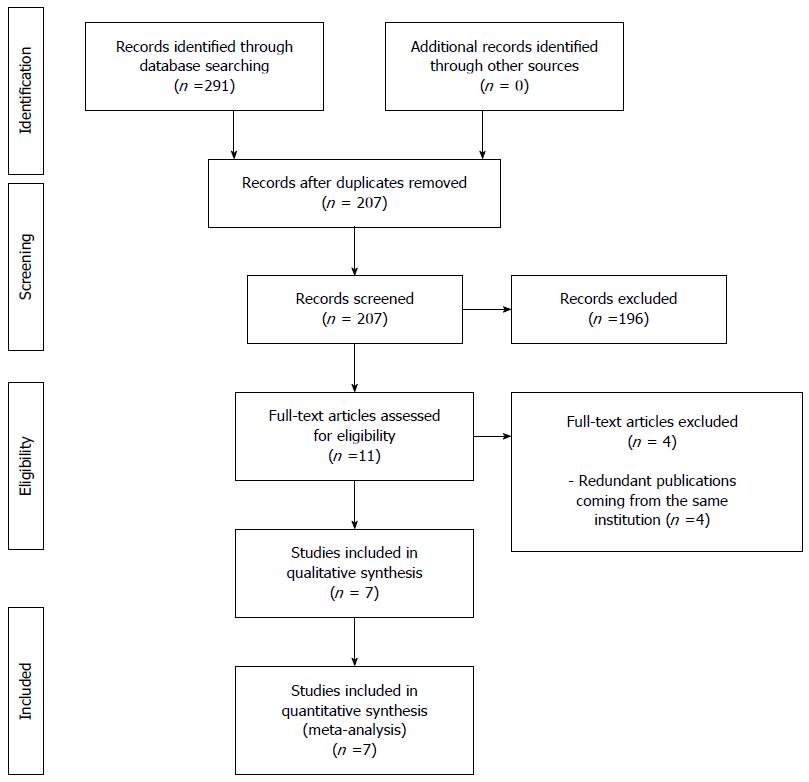
Figure 1 Study selection.
Figure 2 Meta-analysis Forest plot concerning estimated blood loss.
Figure 3 Meta analysis Forest plot concerning operative time.
Figure 4 Meta-analysis Forest plot concerning conversion.
Figure 5 Meta-analysis Forest plot concerning R1 resection rate.
Figure 6 Meta-analysis Forest plot concerning morbidity.
Figure 7 Meta-analysis Forest plot concerning hospital stay.
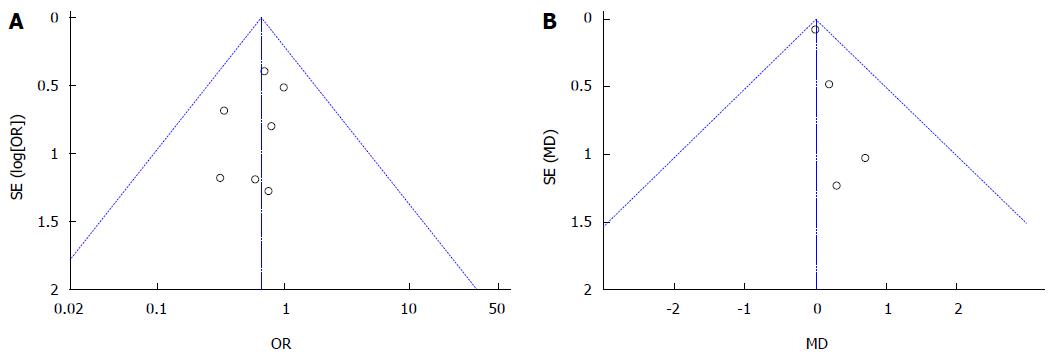
Figure 8 Funnel plot of morbidity (A) and hospital stay (B) in all included studies.
-
Citation: Montalti R, Berardi G, Patriti A, Vivarelli M, Troisi RI. Outcomes of robotic
vs laparoscopic hepatectomy: A systematic review and meta-analysis. World J Gastroenterol 2015; 21(27): 8441-8451 - URL: https://www.wjgnet.com/1007-9327/full/v21/i27/8441.htm
- DOI: https://dx.doi.org/10.3748/wjg.v21.i27.8441


