Copyright
©The Author(s) 2015.
World J Gastroenterol. Jul 21, 2015; 21(27): 8398-8407
Published online Jul 21, 2015. doi: 10.3748/wjg.v21.i27.8398
Published online Jul 21, 2015. doi: 10.3748/wjg.v21.i27.8398
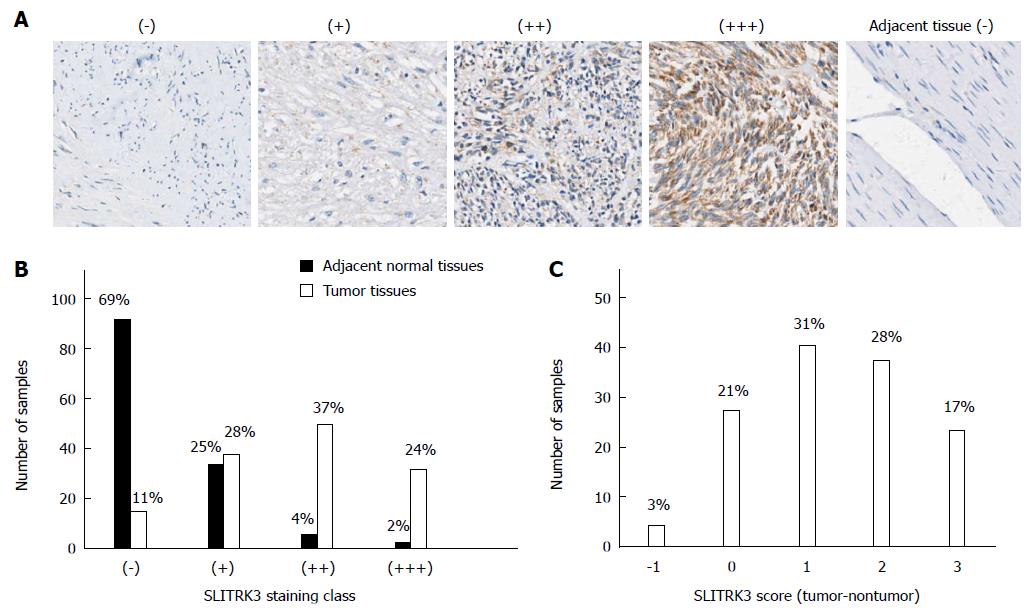
Figure 1 Immunohistochemistry of SLITRK3 in gastrointestinal stromal tumor and adjacent non-tumor tissues.
A: Representative images of SLITRK3 expression levels detected in tumor and adjacent tissue; B: Frequency distribution of SLITRK3 staining scores in tumor and adjacent non-tumor tissues; C: Frequency distribution of different SLITRK3 expression levels calculated by normalizing the SLITRK3 expression score in tumor against that in adjacent non-tumor tissues.
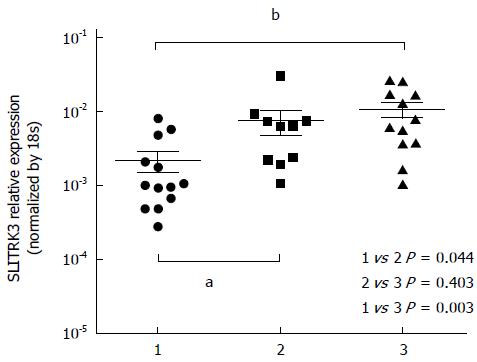
Figure 2 SLITRK3 mRNA expression in 35 gastrointestinal stromal tumor tissues with different risk grades (aP < 0.
05, group 1 vs group 2; bP < 0.01, group 1 vs group 3). The SLITRK3 mRNA levels in GIST tumor tissues of the high risk group (group 3) and intermediate risk group (group 2) were significantly higher than those of the low-risk group (group 1) (P = 0.003 and P = 0.044).
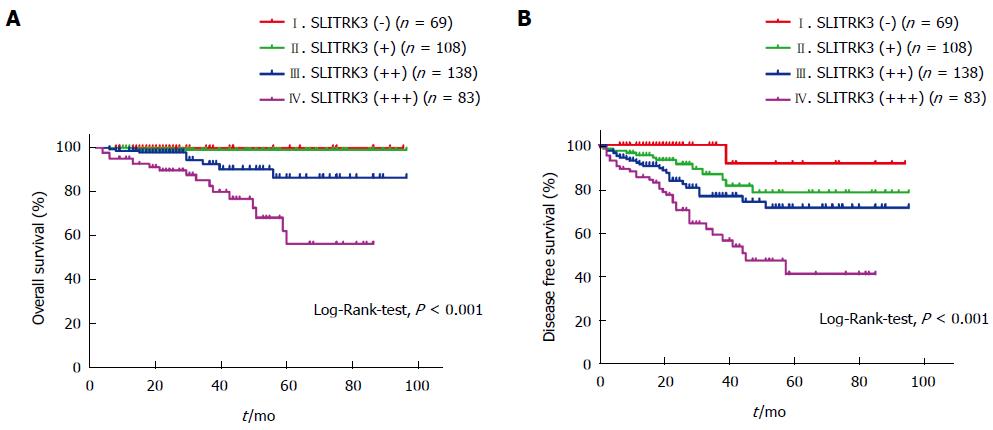
Figure 3 Overall survival (A) and disease-free survival (B) of 398 gastrointestinal stromal tumors according to SLITRK3 expression.
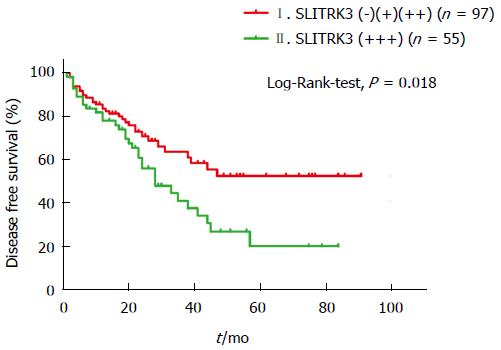
Figure 4 Disease-free survival analysis in a subgroup of 152 high risk cases.
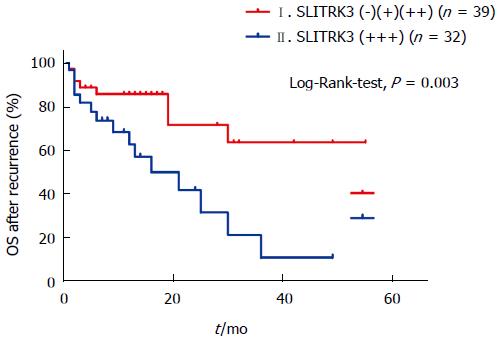
Figure 5 Overall survival analysis in 71 patients after recurrence.
- Citation: Wang CJ, Zhang ZZ, Xu J, Wang M, Zhao WY, Tu L, Zhuang C, Liu Q, Shen YY, Cao H, Zhang ZG. SLITRK3 expression correlation to gastrointestinal stromal tumor risk rating and prognosis. World J Gastroenterol 2015; 21(27): 8398-8407
- URL: https://www.wjgnet.com/1007-9327/full/v21/i27/8398.htm
- DOI: https://dx.doi.org/10.3748/wjg.v21.i27.8398


