Copyright
©The Author(s) 2015.
World J Gastroenterol. Jul 21, 2015; 21(27): 8366-8372
Published online Jul 21, 2015. doi: 10.3748/wjg.v21.i27.8366
Published online Jul 21, 2015. doi: 10.3748/wjg.v21.i27.8366
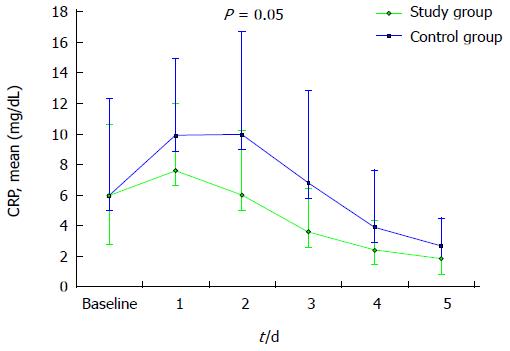
Figure 1 C reactive protein levels.
Mean C reactive protein (CRP) levels, over time, in the two groups.
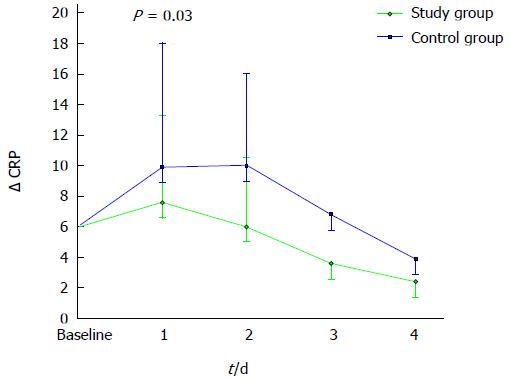
Figure 2 C reactive protein mean levels over time and their variation from baseline.
C reactive protein (CRP) variation from baseline, over time, in the two groups. Δ CRP = mean CRP - mean CRP at baseline.
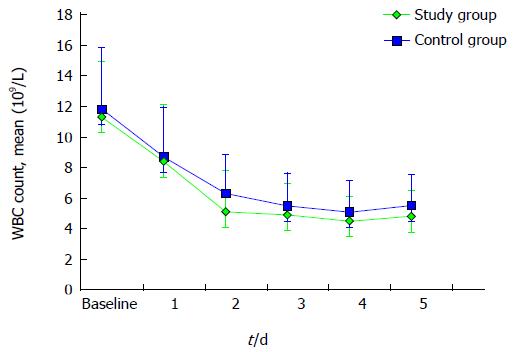
Figure 3 White blood cells count.
Mean white blood cells (WBC) count, over time, in the two groups.
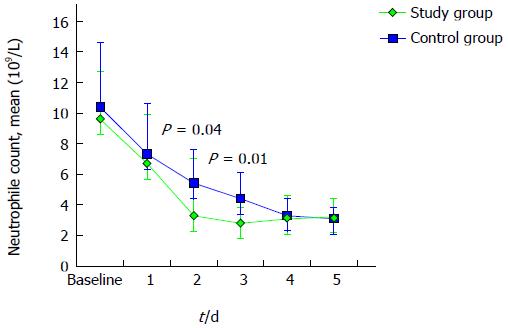
Figure 4 Neutrophile count.
Mean neutrophile count, over time, in the two groups.
- Citation: Nespoli L, Lo Bianco G, Uggeri F, Romano F, Nespoli A, Bernasconi DP, Gianotti L. Effect of oral mesalamine on inflammatory response in acute uncomplicated diverticulitis. World J Gastroenterol 2015; 21(27): 8366-8372
- URL: https://www.wjgnet.com/1007-9327/full/v21/i27/8366.htm
- DOI: https://dx.doi.org/10.3748/wjg.v21.i27.8366


