Copyright
©The Author(s) 2015.
World J Gastroenterol. Jul 21, 2015; 21(27): 8326-8339
Published online Jul 21, 2015. doi: 10.3748/wjg.v21.i27.8326
Published online Jul 21, 2015. doi: 10.3748/wjg.v21.i27.8326
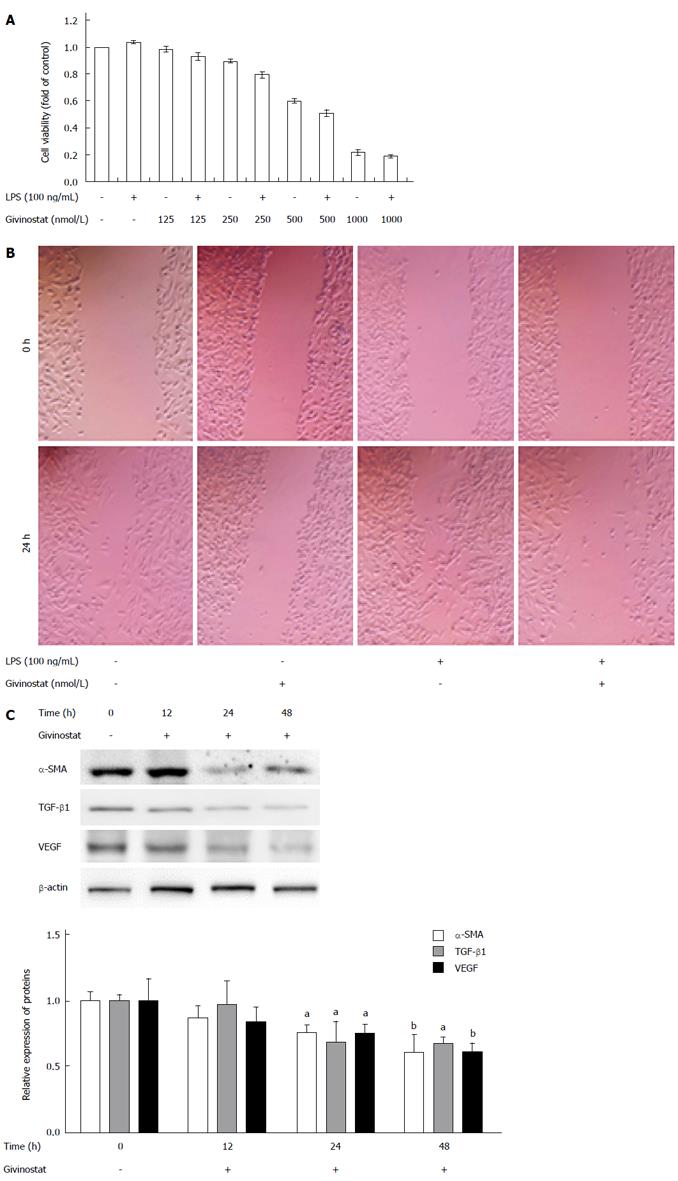
Figure 1 Effects of givinostat in suppressing proliferation and migration of JS-1 cells.
A: Givinostat inhibits JS-1 cell proliferation in a concentration-dependent manner. The cell inhibition rate significantly differed between the group cotreated with givinostat ≥ 250 nmol/L plus lipopolysaccharide (LPS) and the group without LPS treatment (same givinostat concentration) (P < 0.05); B: The cell migration area significantly decreased in the group cotreated with givinostat plus LPS (P < 0.05); C: Compared with the control group, treatment with givinostat for 24 h or 48 h significantly suppressed expression of α-smooth muscle actin (SMA), transforming growth factor (TGF)-β1 and Vascular endothelial growth factor (VEGF). aP < 0.05, bP < 0.01 vs control group.
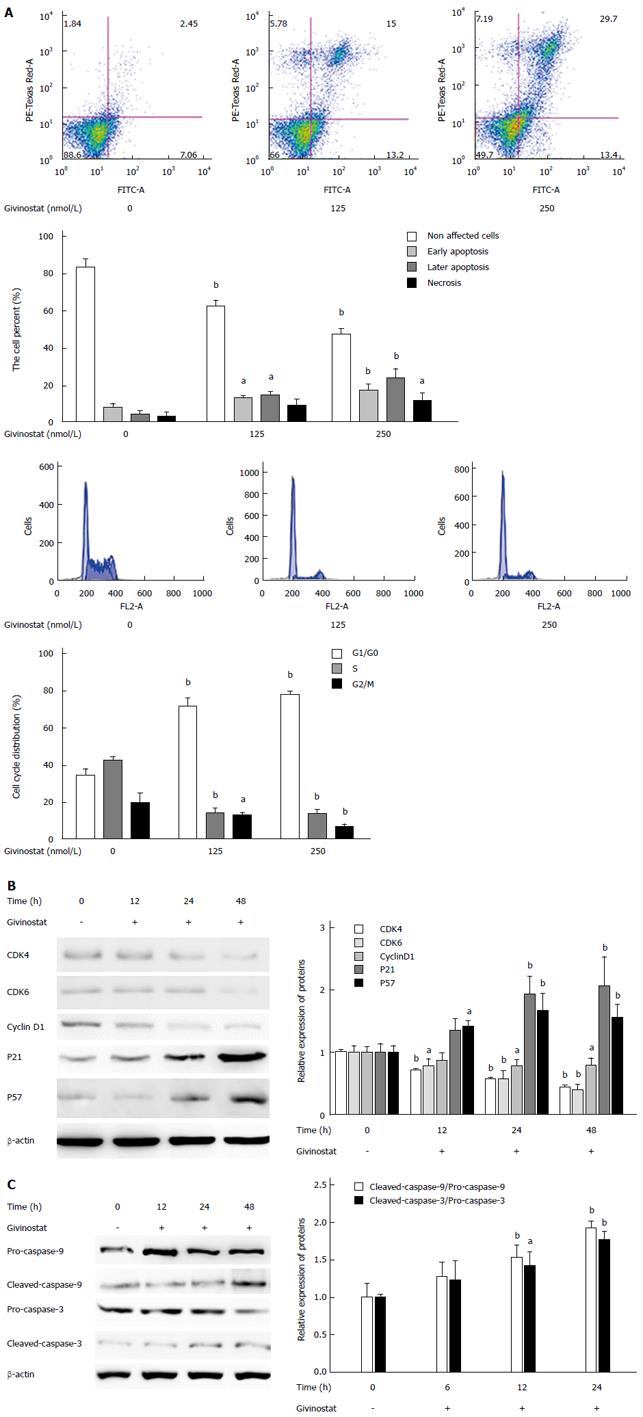
Figure 2 Effects of givinostat on apoptosis and cell cycle of JS-1 cells.
A: Flow cytometry shows that the givinostat treatment induces JS-1 cell apoptosis in a concentration-dependent manner. The numbers of apoptotic and necrotic cells progressively increased when the concentration of givinostat increased; B: Givinostat arrested the JS-1 cells at G0/G1 phase; C: Givinostat activated caspase-3 and caspase-9 in JS-1 cells without causing changes in the precursors of these two proteins. aP < 0.05, bP < 0.01 vs the control group.
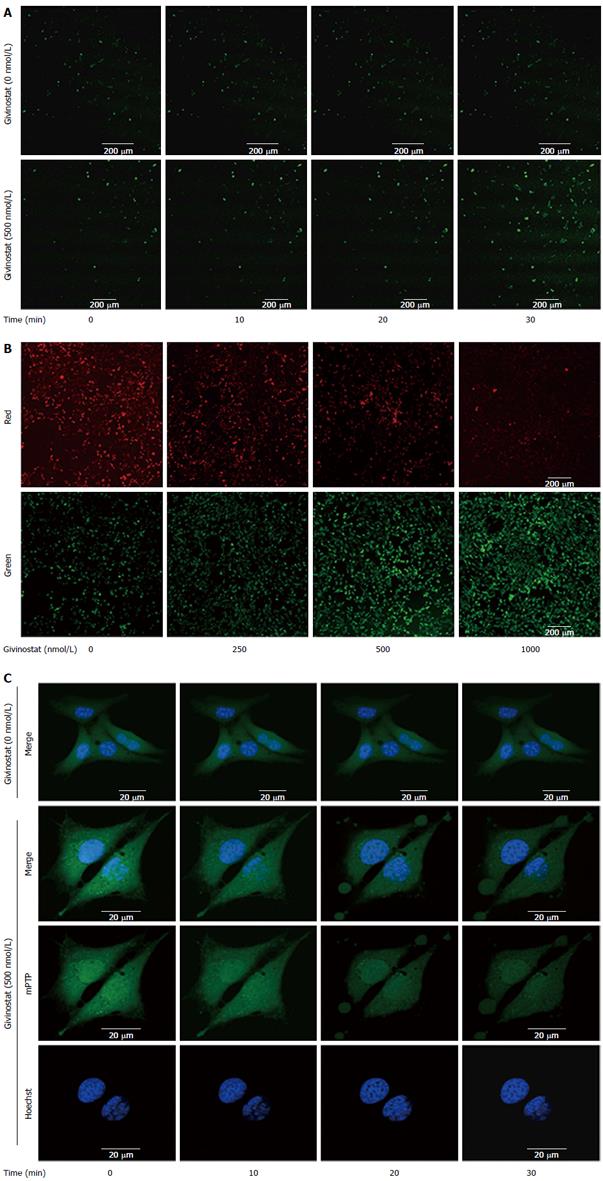
Figure 3 Effects of givinostat on the reactive oxygen species profile, mitochondrial membrane potential, and mitochondrial permeability transition pore opening in JS-1 cells.
A: Effects of givinostat on reactive oxygen species (ROS) in JS-1 cells were determined by 2’,7’-dichlorofluorescein diacetate. Green fluorescence represents the intracellular ROS. Givinostat significantly increased ROS production, in particular at 30 min (P < 0.01); B: Mitochondrial membrane potential was detected using the fluorescent probe JC-1. The green and red fluorescence represented the low and high membrane potentials, respectively. Givinostat reduced mitochondrial membrane potential in a concentration-dependent manner, particularly at 1000 nmol/L (P < 0.01); C: The mitochondrial permeability transition pore (mPTP) opening was detected by coloading with calcein-AM and CoCl2. In the givinostat treatment group, considerable mPTP opening was observed, along with decreased intensity of fluorescence in comparison to that of the control group.
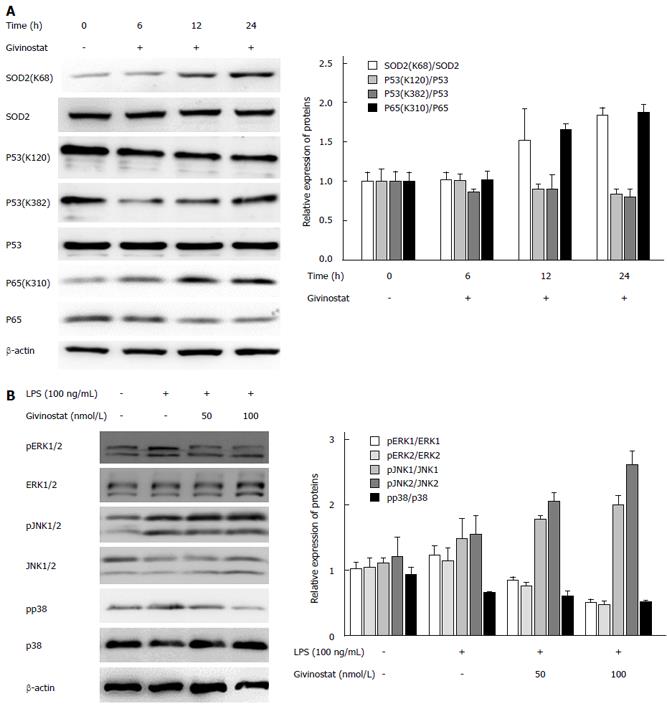
Figure 4 Changes in histone acetylation and regulation of lipopolysaccharide-activated mitogen-activated protein kinase signaling in givinostat-treated JS-1 cells.
A: Effects of givinostat on the post-translational modifications of superoxide dismutase (SOD)2, p53, nuclear factor (NF)-κB, and p65 were analyzed by Western blotting. SOD2 (acetyl K68) acetylation was upregulated, while the expression profile of SOD2 protein showed no significant change. The ratios show a significant difference when compared with those in the control group, in particular at 24 h. Similarly, acetylation of NF-κB p65 (acetyl K310) was upregulated, while its protein expression showed no significant change. There were no obvious changes in the expression profiles of p53, p53 (acetyl K382), and p53 (acetyl K120); B: Expression of extracellular signal-regulated kinase (ERK)1/2, phosphorylated ERK1/2, p38, and phosphorylated p38 was upregulated after lipopolysaccharide (LPS) treatment; in contrast, givinostat inhibited the upregulated expression of phosphorylated ERK1/2 and phosphorylated P38 induced by LPS in a time-dependent manner, while no obvious effect on c-Jun N-terminal kinase (JNK)1/2 and phosphorylated JNK1/2 was found.
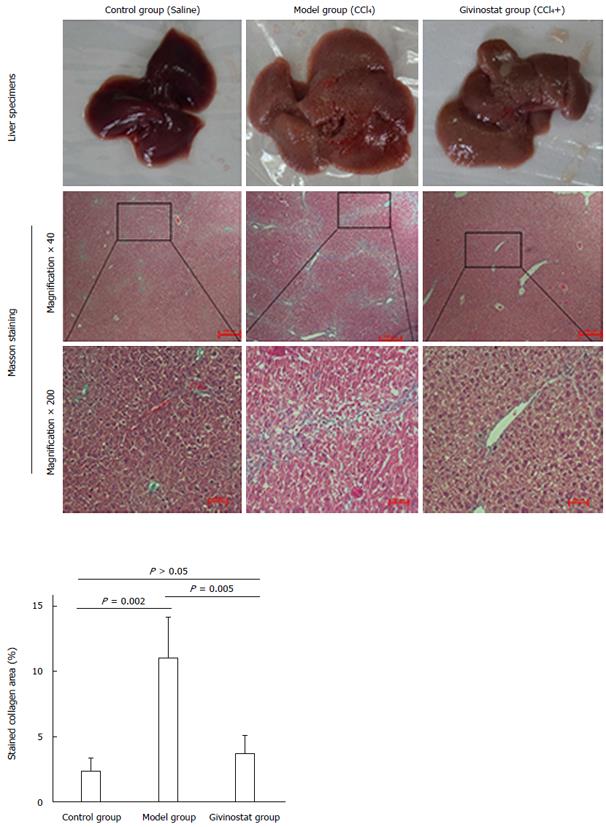
Figure 5 Pathologic changes of liver tissue in mouse models of liver fibrosis induced by CCl4 treatment.
Control group: The hepatic lobules had integrated structures, with only a small number of stained collagen fibers in the portal area. There was no obvious collagen deposition, and no degeneration, necrosis, or inflammatory cell infiltration. Model group: The normal hepatic lobules were damaged, along with the markedly increased collagen in liver tissue. The collagen fibers extended along the portal area or outwards to the inflammatory necrosis area, forming fiber spacing with varied thickness. Pseudolobules were visible. Givinostat group: compared with the model group, the structure of liver tissue was markedly improved, along with the obviously decreased collagen deposition. Collagen area percent was significantly reduced in givinostat group compared to the model group (P = 0.005).
- Citation: Wang YG, Xu L, Wang T, Wei J, Meng WY, Wang N, Shi M. Givinostat inhibition of hepatic stellate cell proliferation and protein acetylation. World J Gastroenterol 2015; 21(27): 8326-8339
- URL: https://www.wjgnet.com/1007-9327/full/v21/i27/8326.htm
- DOI: https://dx.doi.org/10.3748/wjg.v21.i27.8326


