Copyright
©The Author(s) 2015.
World J Gastroenterol. Jul 7, 2015; 21(25): 7742-7753
Published online Jul 7, 2015. doi: 10.3748/wjg.v21.i25.7742
Published online Jul 7, 2015. doi: 10.3748/wjg.v21.i25.7742
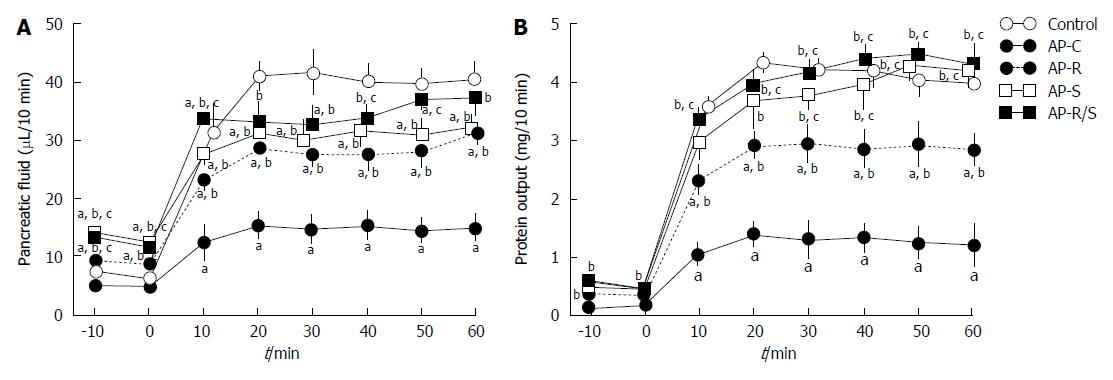
Figure 1 Pancreatic fluid secretion (A) and protein output (B) in response to bombesin stimulation in the four different treatment groups on day 12 after induction of acute pancreatitis.
Results are the mean ± SE of 6-8 experiments. aP < 0.05 vs control; bP < 0.01 vs AP-C; cP < 0.05 vs AP-R. AP: Acute pancreatitis.
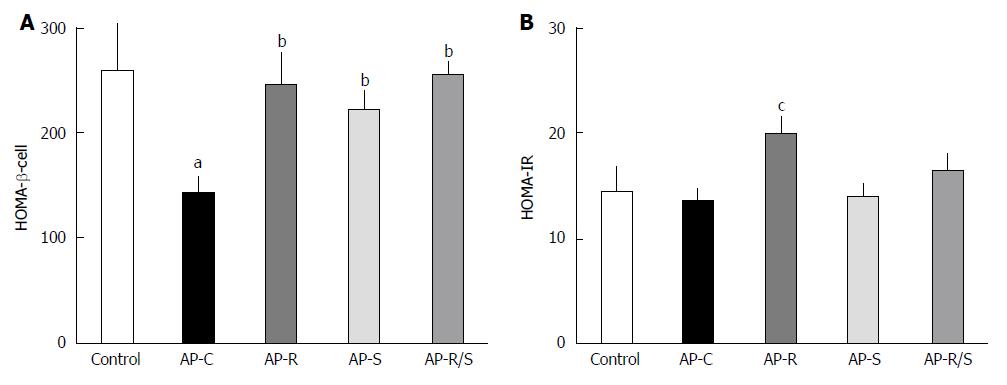
Figure 2 HOMA-β-cell (A) and HOMA-IR (B) in the four different treatment groups on day 12 after induction of acute pancreatitis.
Results are the mean ± SE of 6-8 experiments. aP < 0.05 vs control, AP-R, AP-S and AP-R/S; bP < 0.01 vs AP-C; cP < 0.05 vs control, AP-C, AP-S and AP-R/S. AP: Acute pancreatitis.
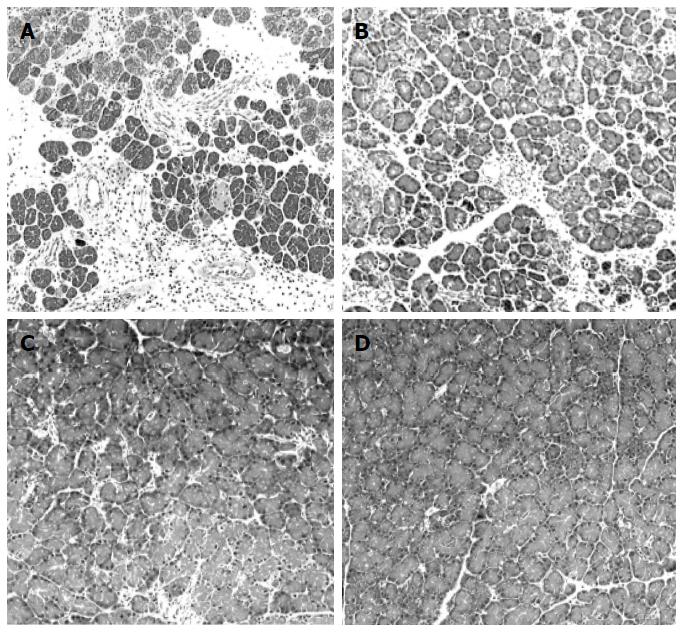
Figure 3 Representative photomicrographs of the pancreas in the four different treatment groups on day 12 after induction of acute pancreatitis.
A: The pancreas of AP-C rat (ad libitum feeding with saline administration) showed destruction of pancreatic acini, tubular complexes and marked infiltration of inflammatory cells, mainly lymphocytes; B: The pancreas of AP-R rat (pancreatic rest) showed minimal histologic alterations with atrophic pancreatic acini and mild inflammatory cell infiltration; The pancreas in AP-S (C) (pancreatic stimulation) and AP-R/S rats (D) (pancreatic rest for the first 5 d followed by pancreatic stimulation for 5 d) showed almost normal architecture. Original magnification × 25. AP: Acute pancreatitis.
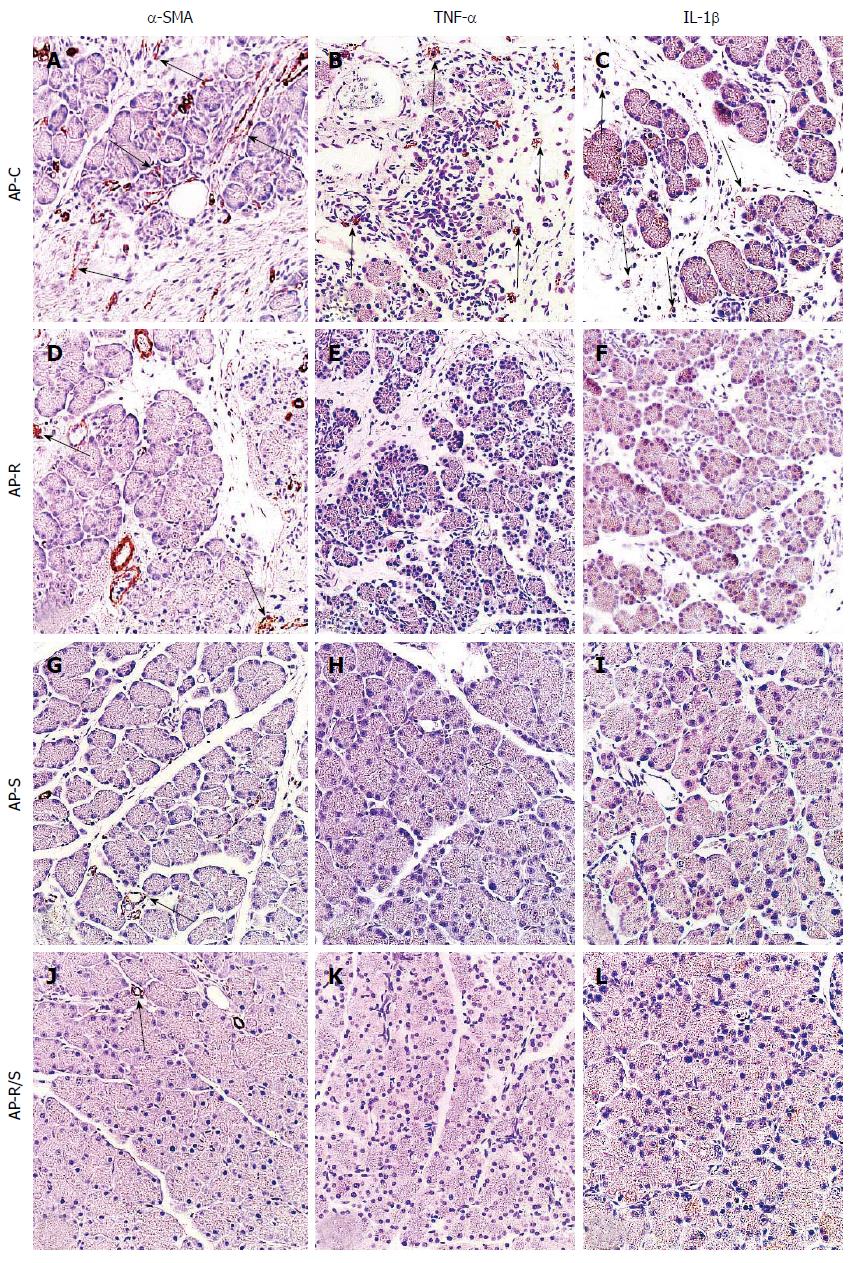
Figure 4 Representative immunohistochemical studies of the pancreas in the four different treatment groups on day 12 after induction of AP.
A: The pancreas of AP-C rats showed strong α-SMA expression in the degenerative regions; In AP-S (G) and AP-R/S rats (J), α-SMA was only detected in pancreatic ducts. In AP-C rats, TNF-α (B) and IL-1β (C) were strongly expressed in inflammatory cells in the pancreas. In AP-R, AP-S and AP-R/S rats, TNF-α (E, H and K) and IL-1β (F, I and L) were not detected in the pancreas; D: Pancreatic rest (AP-R) markedly reduced α-SMA expression. Arrows in A, D, G and J indicate α-SMA expression in the pancreas. Arrows in B indicate TNF-α expression in the pancreas. Arrows in C indicate IL-1β expression in the pancreas. Original magnification × 50.
- Citation: Jia D, Yamamoto M, Otsuki M. Effect of endogenous cholecystokinin on the course of acute pancreatitis in rats. World J Gastroenterol 2015; 21(25): 7742-7753
- URL: https://www.wjgnet.com/1007-9327/full/v21/i25/7742.htm
- DOI: https://dx.doi.org/10.3748/wjg.v21.i25.7742


